


As a developer, mastering debugging techniques within integrated development environments (IDEs) is crucial for efficient and effective Java application development. Let's explore what IDEs are, why you should adeptly debug Java applications using them, and the step-by-step process to accomplish this.
What are IDEs?

IDEs, or Integrated Development Environments, are software suites that combine tools necessary for software development into a single graphical user interface. Common features include a code editor, debugger, compiler, and project management tools.
Popular IDEs for Java development include:
- IntelliJ IDEA
- Eclipse
- NetBeans
- Visual Studio Code with Java extensions
These IDEs not only help write and compile code but also provide extensive debugging tools, simplifying the process of identifying and resolving issues in your code.
Why Master Debugging Java Applications Using IDEs?
Debugging is vital for producing reliable and efficient code. Here are a few reasons why mastering debugging within IDEs is beneficial:
- Efficiency: IDEs provide powerful debugging capabilities that streamline the process of identifying and fixing bugs, saving valuable development time.
- Visualization: They offer visual aids like breakpoints, stack traces, and variable watchers that simplify understanding the code flow and state at runtime.
- Integration: Debugging tools are seamlessly integrated with other development tools within the IDE, providing a cohesive and unified workflow.
- Automation: IDEs can automate repetitive debugging tasks, allowing developers to focus more on solving complex problems.
How to Debug Java Applications Using IDEs?
Here’s a practical step-by-step guide on how to debug Java applications using an IDE, specifically IntelliJ IDEA, which is widely regarded for its robust debugging capabilities.
Step 1: Setting Up Your Project
First, ensure your Java project is correctly set up in the IDE:
- Open IntelliJ IDEA and create a new Java project or import an existing one.
- Ensure your project structure is correctly configured with all necessary dependencies.

Step 2: Writing Code
Write your Java code, ensuring you have a somewhat complex example that would benefit from debugging. Here’s a simple example:
public class Main {
    public static void main(String[] args) {
        int result = addNumbers(5, 3);
        System.out.println("Result: " + result);
    }

    public static int addNumbers(int a, int b) {
        int sum = a + b;
        return sum;
    }
}

Step 3: Setting Breakpoints
Breakpoints are crucial for inspecting the code flow:
- Click in the left margin next to the line number where you want to pause execution (e.g., on int sum = a b;).

Step 4: Running in Debug Mode
To start debugging:
- Click the debug icon (a bug symbol) or press Shift F9.
- The application will start and pause execution at the breakpoint.

Step 5: Inspecting Variables and State
When execution is paused, you can inspect variables and the application state:
- Hover over variables to see their current values.
- Use the Debug window to view the call stack, variables, and more.

Step 6: Stepping Through Code
Control execution using step commands:
- Step Over (F8): Move to the next line of code.
- Step Into (F7): Enter into the method call.
- Step Out (Shift F8): Exit the current method.
- Resume (F9): Continue execution until the next breakpoint.

Step 7: Evaluating Expressions
Evaluate complex expressions:
- Right-click the code and select "Evaluate Expression" to test specific conditions or logic on-the-fly.

Introducing EchoAPI for IntelliJ IDEA
Now that you understand how to debug Java applications using IntelliJ IDEA, let me introduce you to a fantastic tool that can further enhance your development experience: EchoAPI for IntelliJ IDEA.
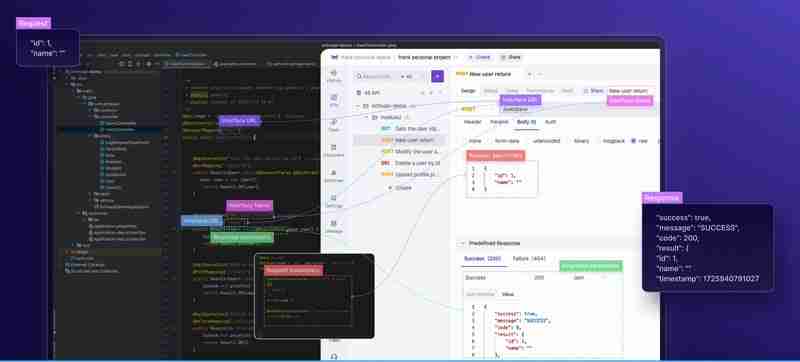
EchoAPI for IntelliJ IDEA is not just another plugin; it’s designed to streamline and elevate your Java development workflow. Imagine having the ability to generate comprehensive API documentation, test APIs instantly, and synchronize your data—all with a few clicks. Let's dive into some of the standout features EchoAPI offers:
Auto-Generated Documentation
With EchoAPI, you can effortlessly create detailed and comprehensive API documentation tailored specifically to your code. This frees you to focus more on coding, while the plugin handles the creation of clear and concise documents, aiding quick understanding and navigation.

One-Click Debugging
EchoAPI significantly boosts productivity by allowing you to test your APIs in real-time with just one click. This feature provides instant responses, helping you identify and fix issues on the fly, thus saving you precious development time.

Custom APIs
Creating and debugging custom APIs has never been easier. EchoAPI lets you craft APIs to meet specific needs and ensures their performance through easy, one-click testing, making your development process smooth and efficient.
One-Click Sync
Backing up your data securely is a breeze with EchoAPI’s One-Click Sync. This feature ensures that your data is safely stored in the EchoAPI Client, offering you peace of mind with up-to-date backups.
Flexible Parameter Parsing
Handling diverse data types and customizing parameter parsing to suit various API scenarios is made simple with EchoAPI. This flexibility ensures your APIs can accommodate a wide range of requests effortlessly.
Mini Lightweight Design
EchoAPI boasts a compact and efficient design, providing a responsive user experience without the bloat of unnecessary software. This minimalistic approach keeps the focus on coding and debugging, maintaining an agile development environment.

These features collectively enhance both the development and debugging processes, making EchoAPI for IntelliJ IDEA an indispensable tool for serious developers. By integrating EchoAPI into your workflow, you not only streamline your tasks but also elevate the overall efficiency and productivity of your coding endeavors.
Conclusion
Mastering debugging in IDEs is essential for any Java developer. It enhances efficiency, helps visualize complex code flows, and integrates seamlessly with other development tools, making it easier to identify and resolve issues. IntelliJ IDEA, with its powerful debugging capabilities, stands out as a premier choice for Java development.
Additionally, the EchoAPI for IntelliJ IDEA plugin further elevates the development experience by offering comprehensive API documentation, instantaneous debugging, custom API creation, secure data backup, flexible parameter parsing, and an efficient, lightweight design.
By combining the robust debugging tools of IntelliJ IDEA with the enhanced functionalities of EchoAPI, developers can achieve a more streamlined, productive, and efficient workflow. Happy coding and debugging!
The above is the detailed content of How to Debug Java Applications Using IDEs. For more information, please follow other related articles on the PHP Chinese website!

Hot AI Tools

Undress AI Tool
Undress images for free

Undresser.AI Undress
AI-powered app for creating realistic nude photos

AI Clothes Remover
Online AI tool for removing clothes from photos.

Clothoff.io
AI clothes remover

Video Face Swap
Swap faces in any video effortlessly with our completely free AI face swap tool!

Hot Article
Hot Tools

Notepad++7.3.1
Easy-to-use and free code editor

SublimeText3 Chinese version
Chinese version, very easy to use

Zend Studio 13.0.1
Powerful PHP integrated development environment

Dreamweaver CS6
Visual web development tools

SublimeText3 Mac version
God-level code editing software (SublimeText3)
Hot Topics


 Difference between HashMap and Hashtable?
Jun 24, 2025 pm 09:41 PM
Difference between HashMap and Hashtable?
Jun 24, 2025 pm 09:41 PM
The difference between HashMap and Hashtable is mainly reflected in thread safety, null value support and performance. 1. In terms of thread safety, Hashtable is thread-safe, and its methods are mostly synchronous methods, while HashMap does not perform synchronization processing, which is not thread-safe; 2. In terms of null value support, HashMap allows one null key and multiple null values, while Hashtable does not allow null keys or values, otherwise a NullPointerException will be thrown; 3. In terms of performance, HashMap is more efficient because there is no synchronization mechanism, and Hashtable has a low locking performance for each operation. It is recommended to use ConcurrentHashMap instead.
 What are static methods in interfaces?
Jun 24, 2025 pm 10:57 PM
What are static methods in interfaces?
Jun 24, 2025 pm 10:57 PM
StaticmethodsininterfaceswereintroducedinJava8toallowutilityfunctionswithintheinterfaceitself.BeforeJava8,suchfunctionsrequiredseparatehelperclasses,leadingtodisorganizedcode.Now,staticmethodsprovidethreekeybenefits:1)theyenableutilitymethodsdirectly
 How does JIT compiler optimize code?
Jun 24, 2025 pm 10:45 PM
How does JIT compiler optimize code?
Jun 24, 2025 pm 10:45 PM
The JIT compiler optimizes code through four methods: method inline, hot spot detection and compilation, type speculation and devirtualization, and redundant operation elimination. 1. Method inline reduces call overhead and inserts frequently called small methods directly into the call; 2. Hot spot detection and high-frequency code execution and centrally optimize it to save resources; 3. Type speculation collects runtime type information to achieve devirtualization calls, improving efficiency; 4. Redundant operations eliminate useless calculations and inspections based on operational data deletion, enhancing performance.
 What is an instance initializer block?
Jun 25, 2025 pm 12:21 PM
What is an instance initializer block?
Jun 25, 2025 pm 12:21 PM
Instance initialization blocks are used in Java to run initialization logic when creating objects, which are executed before the constructor. It is suitable for scenarios where multiple constructors share initialization code, complex field initialization, or anonymous class initialization scenarios. Unlike static initialization blocks, it is executed every time it is instantiated, while static initialization blocks only run once when the class is loaded.
 What is the Factory pattern?
Jun 24, 2025 pm 11:29 PM
What is the Factory pattern?
Jun 24, 2025 pm 11:29 PM
Factory mode is used to encapsulate object creation logic, making the code more flexible, easy to maintain, and loosely coupled. The core answer is: by centrally managing object creation logic, hiding implementation details, and supporting the creation of multiple related objects. The specific description is as follows: the factory mode handes object creation to a special factory class or method for processing, avoiding the use of newClass() directly; it is suitable for scenarios where multiple types of related objects are created, creation logic may change, and implementation details need to be hidden; for example, in the payment processor, Stripe, PayPal and other instances are created through factories; its implementation includes the object returned by the factory class based on input parameters, and all objects realize a common interface; common variants include simple factories, factory methods and abstract factories, which are suitable for different complexities.
 What is the `final` keyword for variables?
Jun 24, 2025 pm 07:29 PM
What is the `final` keyword for variables?
Jun 24, 2025 pm 07:29 PM
InJava,thefinalkeywordpreventsavariable’svaluefrombeingchangedafterassignment,butitsbehaviordiffersforprimitivesandobjectreferences.Forprimitivevariables,finalmakesthevalueconstant,asinfinalintMAX_SPEED=100;wherereassignmentcausesanerror.Forobjectref
 Why do we need wrapper classes?
Jun 28, 2025 am 01:01 AM
Why do we need wrapper classes?
Jun 28, 2025 am 01:01 AM
Java uses wrapper classes because basic data types cannot directly participate in object-oriented operations, and object forms are often required in actual needs; 1. Collection classes can only store objects, such as Lists use automatic boxing to store numerical values; 2. Generics do not support basic types, and packaging classes must be used as type parameters; 3. Packaging classes can represent null values ??to distinguish unset or missing data; 4. Packaging classes provide practical methods such as string conversion to facilitate data parsing and processing, so in scenarios where these characteristics are needed, packaging classes are indispensable.
 What is type casting?
Jun 24, 2025 pm 11:09 PM
What is type casting?
Jun 24, 2025 pm 11:09 PM
There are two types of conversion: implicit and explicit. 1. Implicit conversion occurs automatically, such as converting int to double; 2. Explicit conversion requires manual operation, such as using (int)myDouble. A case where type conversion is required includes processing user input, mathematical operations, or passing different types of values ??between functions. Issues that need to be noted are: turning floating-point numbers into integers will truncate the fractional part, turning large types into small types may lead to data loss, and some languages ??do not allow direct conversion of specific types. A proper understanding of language conversion rules helps avoid errors.
