


Monitorix is an open-source, free, and most powerful lightweight tool designed to monitor system and network resources in Linux. It regularly collects system and network data and displays the information in graphs using its own web interface (which listens on the port 8080/TCP).
Monitorix allows for monitoring overall system performance and also helps in detecting bottlenecks, failures, unwanted long response times, and other abnormal activities.

It contains generally two programs: a collector, called monitorix, which is a Perl daemon that is started automatically like any other system service, and a CGI script called monitorix.cgi.
It is written in Perl language and licensed under the terms of GNU (General Public License) as published by the FSP (Free Software Foundation). It uses RRDtool to generate graphs and display them using the web interface.
This tool is specifically created for monitoring Red Hat-based distributions and Debian-based distributions, but today it runs on many different flavors of GNU/Linux distributions and even it runs on UNIX systems like OpenBSD, NetBSD, and FreeBSD.
The development of Monitorix is currently in an active state and adding new features, new graphs, new updates, and fixing bugs to offer a great tool for Linux system/network administration.
Monitorix Features
- System load average, active processes, per-processor kernel usage, global kernel usage, and memory allocation.
- Monitors Disk drive temperatures and health.
- Filesystem usage and I/O activity of filesystems.
- Network traffic usage up to 10 network devices.
- System services include SSH, FTP, Vsftpd, ProFTP, SMTP, POP3, IMAP, POP3, VirusMail, and Spam.
- MTA Mail statistics including input and output connections.
- Network port traffic including TCP, UDP, etc.
- FTP statistics with log file formats of FTP servers.
- Apache statistics of local or remote servers.
- MySQL statistics of local or remote servers.
- Squid Proxy Web Cache statistics.
- Fail2ban statistics.
- Monitor remote servers (Multihost).
- Ability to view statistics in graphs or in plain text tables per day, week, month, or year.
- Ability to zoom graphs for a better view.
- Ability to define the number of graphs per row.
- Built-in HTTP server.
For a full list of new features and updates, please check out the official feature page.
Installing Monitorix on an RHEL/CentOS/Fedora Linux
To install the most recent version of Monitorix, you need to enable the EPEL repository on the system as shown.
---------- <strong>On RHEL 9 Based Systems</strong> ----------
# yum install https://dl.fedoraproject.org/pub/epel/epel-release-latest-9.noarch.rpm

---------- <strong>On RHEL 8 Based Systems</strong> ----------
# yum install https://dl.fedoraproject.org/pub/epel/epel-release-latest-8.noarch.rpm

---------- <strong>On RHEL 7 Based Systems</strong> ----------
# yum install https://dl.fedoraproject.org/pub/epel/epel-release-latest-7.noarch.rpm
Once EPEL is installed, you can install the following required packages using the yum command.
# yum install rrdtool rrdtool-perl perl-libwww-perl perl-MailTools perl-CGI perl-DBI perl-XML-Simple perl-Config-General perl-IO-Socket-SSL perl-HTTP-Server-Simple wget
Next, install the latest version of the ‘Monitorix‘ package from the EPEL Repository as shown.
# yum install monitorix

Once successfully installed, please have a look at the main configuration file ‘/etc/monitorix/monitorix.conf‘ to add some extra settings according to your system and enable or disable graphs.
# vi /etc/monitorix/monitorix.conf

Finally, add Monitorix service to system start-up and start the service with the following commands.
# systemctl enable monitorix
# systemctl start monitorix
# systemctl status monitorix

Once, you’ve started the service, the program will start collecting system information according to the configuration set in the ‘/etc/monitorix/monitorix.conf‘ file, and after a few minutes, you will start seeing the system graphs from your browser at.
http://localhost:8080/monitorix/
OR
http://Server-IP:8080/monitorix/

If you have SELinux in the enabled state, then graphs are not visible and you will get tons of error messages in the ‘/var/log/messages‘ or ‘/var/log/audit/audit.log‘ file about access denied to RRD database files. To get rid of such error messages and visible graphs, you need to disable SELinux.
To Turn Off SELinux, simply change the line “enforcing” to “disabled” in the ‘/etc/selinux/config’ file.
SELINUX=disabled
The above will disable SELinux temporarily until you reboot the machine. If you want the system to start in always disable mode, you need to reboot the system.
Installing Monitorix on a Ubuntu/Debian/Linux Mint
The Monitorix installation on a newer release should be done using the following apt command.
$ sudo apt install monitorix
Users in older releases can use the Izzy repository, which is an experimental repository but the packages from this repository should work on all versions of Ubuntu, Debian, etc.
However, no warranties are given – so the risk is all yours. If you still want to add this repository for automatic updates via apt-get, simply follow the steps provided below for automatic installation.
Add the following line to your ‘/etc/apt/sources.list’ file.
deb http://apt.izzysoft.de/ubuntu generic universe
Get the GPG key for this repository, you can get it using the wget command.
# wget http://apt.izzysoft.de/izzysoft.asc
Once downloaded, add this GPG key to the apt configuration by using the command ‘apt-key‘ as shown below.
# apt-key add izzysoft.asc
Finally, install the package via the repository.
# apt-get update
# apt-get install monitorix
Manual Installation Using .Deb Package
Manually, download the latest version of the .deb package and install it with taking care of required dependencies as shown below.
# apt-get update
# apt-get install rrdtool perl libwww-perl libmailtools-perl libmime-lite-perl librrds-perl libdbi-perl libxml-simple-perl libhttp-server-simple-perl libconfig-general-perl libio-socket-ssl-perl
# wget https://www.monitorix.org/monitorix_3.14.0-izzy1_all.deb
# dpkg -i monitorix_3.14.0-izzy1_all.deb
During installation, a web server configuration takes place. So, you need to reload the Apache web server to reflect the new configuration.
# service apache2 restart         [On <strong>SysVinit</strong>]
# systemctl restart apache2       [On <strong>SystemD</strong>]
Monitorix comes with a default configuration, if you wish to change or adjust some settings take a look at the configuration file at ‘/etc/monitorix.conf‘. Once you’ve done the changes reload the service for the new configuration to take effect.
# service monitorix restart         [On <strong>SysVinit</strong>]
# systemctl restart monitorix       [On <strong>SystemD</strong>]
Now point your browser to ‘http://localhost:8080/monitorix‘ and start watching graphs of your system. It can be accessed from localhost only if you wish to allow access to remote IPs. Simply open the ‘/etc/apache2/conf.d/monitorix.conf‘ file and add IP’s to the ‘Allow from‘ clause. For example, see below.
<directory></directory>
        DirectoryIndex monitorix.cgi
        Options ExecCGI
        Order Deny,Allow
        Deny from all
        <strong>Allow from 172.16.16.25</strong>
After you made changes to the above configuration, do not forget to restart Apache.
# service apache2 restart         [On <strong>SysVinit</strong>]
# systemctl restart apache2       [On <strong>SystemD</strong>]
Monitorix Screenshots
Please check out the following screenshots.
Monitorix Homepage

Monitor Linux Load Average

Monitor Linux Kernel Usage

Monitor Linux Kernel Processor

Monitor Linux Disk Health

Monitor Linux Filesystem and Disk I/O Read

Monitor Linux Network Traffic

Monitor Linux System Services

Monitor Linux Network Port Traffic

Monitor Linux Apache Statistics

Monitor MySQL/MariaDB Statistics

Reference Links:
- Monitorix Homepage
- Monitorix Documentation
The above is the detailed content of Monitorix – A Linux System and Network Monitoring Tool. For more information, please follow other related articles on the PHP Chinese website!

Hot AI Tools

Undress AI Tool
Undress images for free

Undresser.AI Undress
AI-powered app for creating realistic nude photos

AI Clothes Remover
Online AI tool for removing clothes from photos.

Clothoff.io
AI clothes remover

Video Face Swap
Swap faces in any video effortlessly with our completely free AI face swap tool!

Hot Article
Hot Tools

Notepad++7.3.1
Easy-to-use and free code editor

SublimeText3 Chinese version
Chinese version, very easy to use

Zend Studio 13.0.1
Powerful PHP integrated development environment

Dreamweaver CS6
Visual web development tools

SublimeText3 Mac version
God-level code editing software (SublimeText3)
Hot Topics


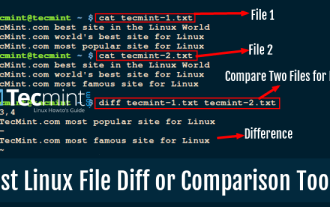 10 Best File Comparison and Difference (Diff) Tools in Linux
Jun 11, 2025 am 10:26 AM
10 Best File Comparison and Difference (Diff) Tools in Linux
Jun 11, 2025 am 10:26 AM
While writing program files or normal text files, programmers and writers sometimes want to know the difference between two files or two versions of the same file. When you compare two computer files on Linux, the difference between their contents is
 How to create a new, empty file from the command line?
Jun 14, 2025 am 12:18 AM
How to create a new, empty file from the command line?
Jun 14, 2025 am 12:18 AM
There are three ways to create empty files in the command line: First, the simplest and safest use of the touch command, which is suitable for debugging scripts or placeholder files; Second, it is quickly created through > redirection but will clear existing content, which is suitable for initializing log files; Third, use echo"> file name to create a file with an empty string, or use echo-n""> file name to avoid line breaks. These three methods have their own applicable scenarios, and choosing the right method can help you complete the task more efficiently.
 5 Best Open Source Mathematical Equation Editors for Linux
Jun 18, 2025 am 09:28 AM
5 Best Open Source Mathematical Equation Editors for Linux
Jun 18, 2025 am 09:28 AM
Are you looking for good software to write mathematical equations? If so, this article provides the top 5 equation editors that you can easily install on your favorite Linux distribution.In addition to being compatible with different types of mathema
 How to Install Eclipse IDE in Debian, Ubuntu, and Linux Mint
Jun 14, 2025 am 10:40 AM
How to Install Eclipse IDE in Debian, Ubuntu, and Linux Mint
Jun 14, 2025 am 10:40 AM
Eclipse is a free integrated development environment (IDE) that programmers around the world use to write software, primarily in Java, but also in other major programming languages using Eclipse plugins.The latest release of Eclipse IDE 2023?06 does
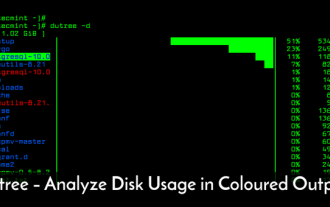 dutree - Analyze File System Disk Usage in Linux
Jun 11, 2025 am 10:33 AM
dutree - Analyze File System Disk Usage in Linux
Jun 11, 2025 am 10:33 AM
dutree is a free, open-source, fast command-line tool for analyzing disk usage, written in the Rust programming language. It was created by combining durep (disk usage reporter) and tree (list directory content in tree-like format) command-line tools
 15 Useful 'ifconfig' Commands to Configure Network in Linux
Jun 11, 2025 am 10:01 AM
15 Useful 'ifconfig' Commands to Configure Network in Linux
Jun 11, 2025 am 10:01 AM
ifconfig in short “interface configuration” utility for system/network administration in Unix/Linux operating systems to configure, manage, and query network interface parameters via command-line interface or in a system configuration scripts
 SCP Linux Command – Securely Transfer Files in Linux
Jun 20, 2025 am 09:16 AM
SCP Linux Command – Securely Transfer Files in Linux
Jun 20, 2025 am 09:16 AM
Linux administrators should be familiar with the command-line environment. Since GUI (Graphical User Interface) mode in Linux servers is not commonly installed.SSH may be the most popular protocol to enable Linux administrators to manage the servers
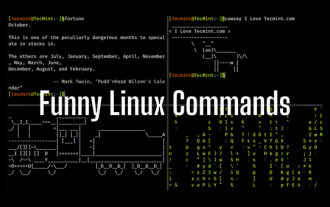 24 Hilarious Linux Commands That Will Make You Laugh
Jun 14, 2025 am 10:13 AM
24 Hilarious Linux Commands That Will Make You Laugh
Jun 14, 2025 am 10:13 AM
Linux has a rich collection of commands, and while many of them are powerful and useful for various tasks, there are also some funny and whimsical commands that you can try out for amusement. 1. sl Command (Steam Locomotive) You might be aware of the
