

How would you debug a server that is slow or has high memory usage?
Jul 06, 2025 am 12:02 AM
If you find that the server is running slowly or the memory usage is too high, you should check the cause before operating. First, you need to check the system resource usage, use top, htop, free -h, iostat, ss -antp and other commands to check the CPU, memory, disk I/O and network connections; secondly, analyze specific process problems, and track the behavior of high-occupancy processes through tools such as ps, jstack, strace; then check logs and monitoring data, view OOM records, exception requests, slow queries and other clues; finally, targeted processing is carried out based on common reasons such as memory leaks, connection pool exhaustion, cache failure storms, and timing task conflicts, optimize code logic, set up a timeout retry mechanism, add current limit fuses, and regularly pressure measurement and evaluation resources.

If you find that the server is running slowly or the memory usage is too high, don't rush to restart. Find out what the problem is first, otherwise you will make it again next time. This type of problem is usually related to resource usage, process exceptions or configuration errors.
Here are some common troubleshooting directions and practical suggestions:
Check system resource usage
First of all, you must know the load and resource consumption of the current system. Commonly used commands include top , htop (more intuitive), free -h and vmstat .
- CPU usage : Use
toporhtopto see which process occupies a large amount of CPU. - Memory usage :
free -hcan quickly view total memory, used memory and cache. - Disk I/O : Use
iostatoriotopto check whether there are processes that frequently read and write to the disk. - Network connection :
netstat -antporss -antpcan tell whether there is an abnormal connection or port occupancy.
If a process suddenly soars the resource, you can first record its PID and analyze it further later.
Analyze specific process issues
After finding a process that occupies high resources, the next step is to see what it is doing. For example, a Java application may cause frequent lag due to Full GC; while a PHP-FPM process may result in dead loops or slow queries in the code.
You can use the following methods to analyze in depth:
- Use
ps -p <pid></pid>to view basic information of the process - For Java applications, you can use
jstack <pid></pid>to grab the thread stack to see if it is stuck somewhere - Use
strace -p <pid></pid>to see which system calls the process and whether there are long-term blocking operations - If it is a database-related service, such as MySQL, check the slow query log to see if there is no unoptimized SQL
Sometimes you will find that although a certain process occupies a high amount, it is actually normal behavior, such as during the execution of the backup task. So we need to look at it in combination with business logic.
Check logs and monitor data
Logs are often the key clue to discovering problems. System logs (such as /var/log/messages or journalctl ), application logs, and database logs must be viewed.
- Is there a record of OOM (Out of Memory) being killed? You can view it through
dmesg | grep -i kill - Are there any abnormal requests, timeouts, retry and other phenomena in the application log?
- Are there any slow query, lock waiting and other situations in the database log?
If there is a monitoring system (such as Prometheus Grafana), it will be easier to see the trend. For example, does memory use continue to rise? Are there any timed tasks that trigger a large number of operations at a specific point in time?
Common Causes and Treatment Suggestions
Some problems are actually quite common, such as:
- Memory Leaks : Programs written in certain languages ??(such as Node.js, Java) are prone to memory leaks, and you can use corresponding tools to analyze heap memory snapshots.
- Connection pool exhaustion : The database connection is not released and the HTTP request is not set timeout may cause accumulation.
- Cache failure storm : After the cache is invalidated on a large scale, all requests are hit to the database, causing an avalanche.
- Timed task conflict : multiple tasks run at the same time, eating up all resources.
When encountering these problems, you can start from these aspects:
- Optimize code logic to reduce unnecessary resource usage
- Set a reasonable timeout and retry mechanism
- Add current limit and fuse to key interfaces
- Regular performance stress testing and resource assessment
Basically that's it. When the server slows down or the memory is exploded, first look at the overall resources, then locate the specific process, then check the logs and monitoring, and finally make judgments based on common patterns. Not every time, expert knowledge is required, but there is a lot of attention to details, especially those that "look normal but are actually problematic".
The above is the detailed content of How would you debug a server that is slow or has high memory usage?. For more information, please follow other related articles on the PHP Chinese website!

Hot AI Tools

Undress AI Tool
Undress images for free

Undresser.AI Undress
AI-powered app for creating realistic nude photos

AI Clothes Remover
Online AI tool for removing clothes from photos.

Clothoff.io
AI clothes remover

Video Face Swap
Swap faces in any video effortlessly with our completely free AI face swap tool!

Hot Article
Hot Tools

Notepad++7.3.1
Easy-to-use and free code editor

SublimeText3 Chinese version
Chinese version, very easy to use

Zend Studio 13.0.1
Powerful PHP integrated development environment

Dreamweaver CS6
Visual web development tools

SublimeText3 Mac version
God-level code editing software (SublimeText3)
Hot Topics


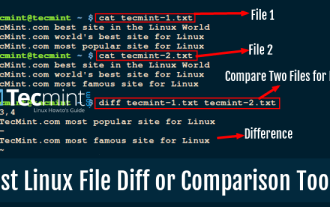 10 Best File Comparison and Difference (Diff) Tools in Linux
Jun 11, 2025 am 10:26 AM
10 Best File Comparison and Difference (Diff) Tools in Linux
Jun 11, 2025 am 10:26 AM
While writing program files or normal text files, programmers and writers sometimes want to know the difference between two files or two versions of the same file. When you compare two computer files on Linux, the difference between their contents is
 How to create a new, empty file from the command line?
Jun 14, 2025 am 12:18 AM
How to create a new, empty file from the command line?
Jun 14, 2025 am 12:18 AM
There are three ways to create empty files in the command line: First, the simplest and safest use of the touch command, which is suitable for debugging scripts or placeholder files; Second, it is quickly created through > redirection but will clear existing content, which is suitable for initializing log files; Third, use echo"> file name to create a file with an empty string, or use echo-n""> file name to avoid line breaks. These three methods have their own applicable scenarios, and choosing the right method can help you complete the task more efficiently.
 5 Best Open Source Mathematical Equation Editors for Linux
Jun 18, 2025 am 09:28 AM
5 Best Open Source Mathematical Equation Editors for Linux
Jun 18, 2025 am 09:28 AM
Are you looking for good software to write mathematical equations? If so, this article provides the top 5 equation editors that you can easily install on your favorite Linux distribution.In addition to being compatible with different types of mathema
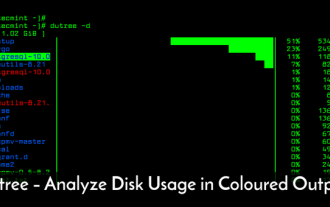 dutree - Analyze File System Disk Usage in Linux
Jun 11, 2025 am 10:33 AM
dutree - Analyze File System Disk Usage in Linux
Jun 11, 2025 am 10:33 AM
dutree is a free, open-source, fast command-line tool for analyzing disk usage, written in the Rust programming language. It was created by combining durep (disk usage reporter) and tree (list directory content in tree-like format) command-line tools
 How to Install Eclipse IDE in Debian, Ubuntu, and Linux Mint
Jun 14, 2025 am 10:40 AM
How to Install Eclipse IDE in Debian, Ubuntu, and Linux Mint
Jun 14, 2025 am 10:40 AM
Eclipse is a free integrated development environment (IDE) that programmers around the world use to write software, primarily in Java, but also in other major programming languages using Eclipse plugins.The latest release of Eclipse IDE 2023?06 does
 15 Useful 'ifconfig' Commands to Configure Network in Linux
Jun 11, 2025 am 10:01 AM
15 Useful 'ifconfig' Commands to Configure Network in Linux
Jun 11, 2025 am 10:01 AM
ifconfig in short “interface configuration” utility for system/network administration in Unix/Linux operating systems to configure, manage, and query network interface parameters via command-line interface or in a system configuration scripts
 SCP Linux Command – Securely Transfer Files in Linux
Jun 20, 2025 am 09:16 AM
SCP Linux Command – Securely Transfer Files in Linux
Jun 20, 2025 am 09:16 AM
Linux administrators should be familiar with the command-line environment. Since GUI (Graphical User Interface) mode in Linux servers is not commonly installed.SSH may be the most popular protocol to enable Linux administrators to manage the servers
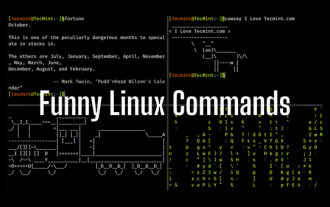 24 Hilarious Linux Commands That Will Make You Laugh
Jun 14, 2025 am 10:13 AM
24 Hilarious Linux Commands That Will Make You Laugh
Jun 14, 2025 am 10:13 AM
Linux has a rich collection of commands, and while many of them are powerful and useful for various tasks, there are also some funny and whimsical commands that you can try out for amusement. 1. sl Command (Steam Locomotive) You might be aware of the
