What are the three pillars of observability (metrics, logs, traces)?
Jul 08, 2025 am 01:11 AMObservability comprehensively understands the system's health through the combination of Metrics, Logs and Traces. 1. Metrics provides quantitative data snapshots, such as CPU usage, which is suitable for real-time monitoring but cannot locate specific problems; 2. Logs records detailed event information, which is suitable for troubleshooting specific errors but large data volume; 3. Traces tracks request links and locates performance bottlenecks, requiring unique identification and context delivery. They ensure system transparency from three levels: overall state, specific details and process path.

The "observability" of the monitoring system sounds quite technical, but to put it bluntly, we want to figure out what the system is doing. It has three core pillars: Metrics, Logs, and Traces. These three have their own emphasis, and put together can give us a more comprehensive understanding of the system's health.
Metrics is a "snapshot" of data
Metrics are essentially some data points that can be quantified and change over time. For example, CPU usage, memory usage, request success rate, etc. They are usually aggregated data, allowing you to quickly see the overall state of the system.
- Advantages : Lightweight, strong real-time, suitable for alarm and trend-seeking.
- Limitations : Too broad, it only tells you "there is a problem", but it doesn't tell you "whether there is a problem".
For example, you find that the CPU of the server suddenly reaches more than 90%. At this time, you know that something is wrong, but which service or request is caused by it? Metrics can't answer this question by itself.
Common practices:
- Record by time series
- Use tools like Prometheus and Grafana to display
- Set thresholds for automatic alarm
Logs are the "recordor" of details
Logs is what we often call logs, which record everything that happens in the system, such as error messages, user operations, API request details, etc. It's more specific than Metrics and can see what's actually happening.
- Advantages : Rich information and suitable for troubleshooting specific problems.
- Limitations : Large data volume, high retrieval cost, and is not suitable for real-time monitoring.
For example, if you see an interface returning 500 errors, you can check the corresponding log to see if a database connection failed or a parameter parsing problem occurs.
Recommended usage:
- Structured logs are better processed, such as JSON format
- Cooperate with ELK (Elasticsearch, Logstash, Kibana) or Loki for centralized management
- Don't output too much useless information to avoid log explosion
Traces is the "map" of the call chain
Traces focuses on a request flow path throughout the system. Especially under the microservice architecture, a request may involve calls between multiple services. Traces can help you clearly see this process and find out the source of performance bottlenecks or failures.
- Advantages : Helps understand the request process, locate slow service or failed links
- Limitations : It is slightly more complex to implement and requires a context propagation mechanism
For example, if you call an API, the response will be very slow. Through Trace tools (such as Jaeger or OpenTelemetry), you can see the entire request link and find that it turns out that a downstream service has spent a lot of time processing data.
Key points:
- Each request must have a unique identity (trace ID)
- Transfer context information between services
- Support sampling control to avoid the pressure caused by full collection
These three things combine to be like installing the system with "eyes", "ears" and "brain". Metrics tells you if there is any problem in the system, Logs helps you find out where the problem is, and Traces tells you how the problem occurs.
Basically that's it.
The above is the detailed content of What are the three pillars of observability (metrics, logs, traces)?. For more information, please follow other related articles on the PHP Chinese website!

Hot AI Tools

Undress AI Tool
Undress images for free

Undresser.AI Undress
AI-powered app for creating realistic nude photos

AI Clothes Remover
Online AI tool for removing clothes from photos.

Clothoff.io
AI clothes remover

Video Face Swap
Swap faces in any video effortlessly with our completely free AI face swap tool!

Hot Article

Hot Tools

Notepad++7.3.1
Easy-to-use and free code editor

SublimeText3 Chinese version
Chinese version, very easy to use

Zend Studio 13.0.1
Powerful PHP integrated development environment

Dreamweaver CS6
Visual web development tools

SublimeText3 Mac version
God-level code editing software (SublimeText3)

Hot Topics
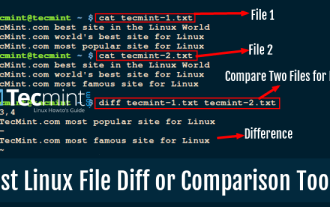
 10 Best File Comparison and Difference (Diff) Tools in Linux
Jun 11, 2025 am 10:26 AM
While writing program files or normal text files, programmers and writers sometimes want to know the difference between two files or two versions of the same file. When you compare two computer files on Linux, the difference between their contents is
 How to create a new, empty file from the command line?
Jun 14, 2025 am 12:18 AM
There are three ways to create empty files in the command line: First, the simplest and safest use of the touch command, which is suitable for debugging scripts or placeholder files; Second, it is quickly created through > redirection but will clear existing content, which is suitable for initializing log files; Third, use echo"> file name to create a file with an empty string, or use echo-n""> file name to avoid line breaks. These three methods have their own applicable scenarios, and choosing the right method can help you complete the task more efficiently.
 5 Best Open Source Mathematical Equation Editors for Linux
Jun 18, 2025 am 09:28 AM
Are you looking for good software to write mathematical equations? If so, this article provides the top 5 equation editors that you can easily install on your favorite Linux distribution.In addition to being compatible with different types of mathema
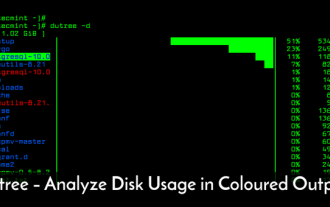
 dutree - Analyze File System Disk Usage in Linux
Jun 11, 2025 am 10:33 AM
dutree is a free, open-source, fast command-line tool for analyzing disk usage, written in the Rust programming language. It was created by combining durep (disk usage reporter) and tree (list directory content in tree-like format) command-line tools
 How to Install Eclipse IDE in Debian, Ubuntu, and Linux Mint
Jun 14, 2025 am 10:40 AM
Eclipse is a free integrated development environment (IDE) that programmers around the world use to write software, primarily in Java, but also in other major programming languages using Eclipse plugins.The latest release of Eclipse IDE 2023?06 does
 15 Useful 'ifconfig' Commands to Configure Network in Linux
Jun 11, 2025 am 10:01 AM
ifconfig in short “interface configuration” utility for system/network administration in Unix/Linux operating systems to configure, manage, and query network interface parameters via command-line interface or in a system configuration scripts
 SCP Linux Command – Securely Transfer Files in Linux
Jun 20, 2025 am 09:16 AM
Linux administrators should be familiar with the command-line environment. Since GUI (Graphical User Interface) mode in Linux servers is not commonly installed.SSH may be the most popular protocol to enable Linux administrators to manage the servers
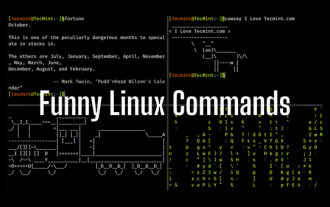
 24 Hilarious Linux Commands That Will Make You Laugh
Jun 14, 2025 am 10:13 AM
Linux has a rich collection of commands, and while many of them are powerful and useful for various tasks, there are also some funny and whimsical commands that you can try out for amusement. 1. sl Command (Steam Locomotive) You might be aware of the


