


Use the top command to quickly view real-time CPU usage, focusing on observing the %Cpu(s) line; 2. Install htop to obtain a clearer visual interface and support mouse operations; 3. Use mpstat to obtain detailed CPU usage statistics, suitable for analyzing performance trends. These three methods are suitable for rough viewing, intuitive display and in-depth analysis of scenarios.

Want to know how to check the CPU usage of Linux system? In fact, there are many methods, and most of them are built into the system without additional software installation.

Use the top command to quickly view
top is one of the most commonly used and intuitive ways. Enter at the terminal:

top
You will see a real-time update interface that includes the overall CPU usage and resource usage of each process. Focus on %Cpu(s) line, which will display the percentage of user state, system state, idle state, etc.
If you just want to see if there is any exception load, this command is the most suitable. Press q to exit.

Use htop to view more clearly (need to install)
Although top is very convenient, its interface is a bit simple. If you are willing to install one more tool, htop is more friendly:
 sudo apt install htop # Debian/Ubuntu
htop
Not only does it distinguish colors clearly, it can also view the usage of each CPU core through mouse operations, making it more friendly to novices.
If the server is a multi-core CPU, htop can help you see at a glance whether a certain core is full while others are idle.
Use mpstat to view detailed statistics
If you need to analyze CPU usage trends over a certain period of time, you can use mpstat . It belongs to the sysstat toolkit. First, confirm whether it is installed:
mpstat 1 5
The meaning of this command is: sample once per second, and collect five times in total. The results will list the usage details of each CPU, such as %usr (user state), %sys (system state), %iowait (wait for I/O), etc.
This is especially useful for troubleshooting performance issues, such as finding that there are too many system calls or the user program is too resource-consuming.
Basically these are the methods. Different scenarios are suitable for different commands. Usually, you can use top and mpstat for detailed analysis. You can also install htop without losing money if you want to visually experience it.
The above is the detailed content of How to check CPU usage in Linux. For more information, please follow other related articles on the PHP Chinese website!

Hot AI Tools

Undress AI Tool
Undress images for free

Undresser.AI Undress
AI-powered app for creating realistic nude photos

AI Clothes Remover
Online AI tool for removing clothes from photos.

Clothoff.io
AI clothes remover

Video Face Swap
Swap faces in any video effortlessly with our completely free AI face swap tool!

Hot Article
Hot Tools

Notepad++7.3.1
Easy-to-use and free code editor

SublimeText3 Chinese version
Chinese version, very easy to use

Zend Studio 13.0.1
Powerful PHP integrated development environment

Dreamweaver CS6
Visual web development tools

SublimeText3 Mac version
God-level code editing software (SublimeText3)
Hot Topics


 Postman Integrated Application on CentOS
May 19, 2025 pm 08:00 PM
Postman Integrated Application on CentOS
May 19, 2025 pm 08:00 PM
Integrating Postman applications on CentOS can be achieved through a variety of methods. The following are the detailed steps and suggestions: Install Postman by downloading the installation package to download Postman's Linux version installation package: Visit Postman's official website and select the version suitable for Linux to download. Unzip the installation package: Use the following command to unzip the installation package to the specified directory, for example /opt: sudotar-xzfpostman-linux-x64-xx.xx.xx.tar.gz-C/opt Please note that "postman-linux-x64-xx.xx.xx.tar.gz" is replaced by the file name you actually downloaded. Create symbols
 Where is the pycharm interpreter?
May 23, 2025 pm 10:09 PM
Where is the pycharm interpreter?
May 23, 2025 pm 10:09 PM
Setting the location of the interpreter in PyCharm can be achieved through the following steps: 1. Open PyCharm, click the "File" menu, and select "Settings" or "Preferences". 2. Find and click "Project:[Your Project Name]" and select "PythonInterpreter". 3. Click "AddInterpreter", select "SystemInterpreter", browse to the Python installation directory, select the Python executable file, and click "OK". When setting up the interpreter, you need to pay attention to path correctness, version compatibility and the use of the virtual environment to ensure the smooth operation of the project.
 The difference between programming in Java and other languages ??Analysis of the advantages of cross-platform features of Java
May 20, 2025 pm 08:21 PM
The difference between programming in Java and other languages ??Analysis of the advantages of cross-platform features of Java
May 20, 2025 pm 08:21 PM
The main difference between Java and other programming languages ??is its cross-platform feature of "writing at once, running everywhere". 1. The syntax of Java is close to C, but it removes pointer operations that are prone to errors, making it suitable for large enterprise applications. 2. Compared with Python, Java has more advantages in performance and large-scale data processing. The cross-platform advantage of Java stems from the Java virtual machine (JVM), which can run the same bytecode on different platforms, simplifying development and deployment, but be careful to avoid using platform-specific APIs to maintain cross-platformity.
 How to manually install plugin packages in VSCode
May 15, 2025 pm 09:33 PM
How to manually install plugin packages in VSCode
May 15, 2025 pm 09:33 PM
The steps to manually install the plug-in package in VSCode are: 1. Download the .vsix file of the plug-in; 2. Open VSCode and press Ctrl Shift P (Windows/Linux) or Cmd Shift P (Mac) to call up the command panel; 3. Enter and select Extensions:InstallfromVSIX..., then select .vsix file and install. Manually installing plug-ins provides a flexible way to install, especially when the network is restricted or the plug-in market is unavailable, but attention needs to be paid to file security and possible dependencies.
 Detailed introduction to each directory of Linux and each directory (reprinted)
May 22, 2025 pm 07:54 PM
Detailed introduction to each directory of Linux and each directory (reprinted)
May 22, 2025 pm 07:54 PM
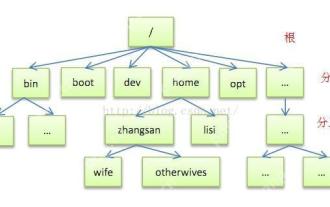
[Common Directory Description] Directory/bin stores binary executable files (ls, cat, mkdir, etc.), and common commands are generally here. /etc stores system management and configuration files/home stores all user files. The root directory of the user's home directory is the basis of the user's home directory. For example, the home directory of the user user is /home/user. You can use ~user to represent /usr to store system applications. The more important directory /usr/local Local system administrator software installation directory (install system-level applications). This is the largest directory, and almost all the applications and files to be used are in this directory. /usr/x11r6?Directory for storing x?window/usr/bin?Many
 After installing Nginx, the configuration file path and initial settings
May 16, 2025 pm 10:54 PM
After installing Nginx, the configuration file path and initial settings
May 16, 2025 pm 10:54 PM
Understanding Nginx's configuration file path and initial settings is very important because it is the first step in optimizing and managing a web server. 1) The configuration file path is usually /etc/nginx/nginx.conf. The syntax can be found and tested using the nginx-t command. 2) The initial settings include global settings (such as user, worker_processes) and HTTP settings (such as include, log_format). These settings allow customization and extension according to requirements. Incorrect configuration may lead to performance issues and security vulnerabilities.
 MySQL installation tutorial teach you step by step the detailed steps for installing and configuration of mySQL step by step
May 23, 2025 am 06:09 AM
MySQL installation tutorial teach you step by step the detailed steps for installing and configuration of mySQL step by step
May 23, 2025 am 06:09 AM
The installation and configuration of MySQL can be completed through the following steps: 1. Download the installation package suitable for the operating system from the official website. 2. Run the installer, select the "Developer Default" option and set the root user password. 3. After installation, configure environment variables to ensure that the bin directory of MySQL is in PATH. 4. When creating a user, follow the principle of minimum permissions and set a strong password. 5. Adjust the innodb_buffer_pool_size and max_connections parameters when optimizing performance. 6. Back up the database regularly and optimize query statements to improve performance.
 Comparison between Informix and MySQL on Linux
May 29, 2025 pm 11:21 PM
Comparison between Informix and MySQL on Linux
May 29, 2025 pm 11:21 PM
Informix and MySQL are both popular relational database management systems. They perform well in Linux environments and are widely used. The following is a comparison and analysis of the two on the Linux platform: Installing and configuring Informix: Deploying Informix on Linux requires downloading the corresponding installation files, and then completing the installation and configuration process according to the official documentation. MySQL: The installation process of MySQL is relatively simple, and can be easily installed through system package management tools (such as apt or yum), and there are a large number of tutorials and community support on the network for reference. Performance Informix: Informix has excellent performance and
