


PromQL is a language used in Prometheus to query time series data. Its core lies in filtering, aggregating and transforming data through indicator names and tags. 1. It supports directly entering the metric name to view relevant time series; 2. Use tag filtering such as {job="node-exporter"} to narrow the range; 3. Provide functions such as rate() to handle incremental counters; 4. Distinguish between real-time vectors (such as up) and range vectors (such as rate() required); 5. Can be used to calculate request rate, error rate and aggregate data across instances, such as avg() by (instance). Mastering PromQL helps build monitoring dashboards and set alert rules.

Prometheus Query Language, or PromQL, is the specialized language used to retrieve and work with time-series data stored in Prometheus. It's what you use when you're querying metrics—like CPU usage, memory consumption, or request latency—cross your systems.
Understanding Time-Series Data in PromQL
At its core, Prometheus collects metrics as time-series data. Each metric has a name (like http_requests_total ) and optional labels that provide additional dimensions such as method, status code, or instance.
For example:
http_requests_total{job="api-server", method="POST", status="200"}
PromQL lets you filter, aggregate, and transform these time series. You can select raw values, apply mathematical operations, or group and sum across instances. The key thing to understand is that everything in PromQL reverses around these labeled time series.
Some basic ways to get started include:
- Typing a metric name directly into the expression browser to see all associated time series.
- Adding label filters to narrow down results, like
{job="node-exporter"}. - Using functions like
rate()orincrease()for counters that only go up.
Working with Instant Vectors and Range Vectors
PromQL deals with two main types of data: instant vectors and range vectors.
An instant vector is a set of time series that each have a single value at the current evaluation time. For example, up gives you the current status of all your targets right now.
A range vector , on the other hand, contains a range of data points over time. These are mainly used with functions like rate() , avg_over_time() , or histogram_quantile() . They're especially useful when analyzing trends or calculating averages over a period.
The distinction matters because not all functions work on both types. For example, rate() expects a counter metric over a time window, so it needs a range vector. But abs() works only on instant vectors since it operates on a per-value basis.
Common Use Cases and Examples
PromQL really shines when you start applying it to real-world monitoring tasks.
If you want to know how many requests per second your API is handling, you might write something like:
rate(http_requests_total[5m])
This shows the per-second average rate of HTTP requests over the last 5 minutes.
Or if you're trying to calculate error rates:
rate(http_requests_total{status=~"5.."}[5m]) / rate(http_requests_total[5m])This divides the rate of 5xx errors by the total request rate to give you an error percentage.
Another common scenario is aggregating metrics across multiple instances. Let's say you want the average CPU usage across all your servers:
avg(rate(node_cpu_seconds_total{mode!="idle"}[5m])) by (instance)Here, we're filtering out idle time, calculating the rate, then grouping the result by instance.
These aren't just queries—they're the foundation for dashboards, alerts, and deeper analysis in Prometheus.
Final Thoughts
PromQL takes some getting used to, especially if you're coming from SQL or another query language. But once you grap how metrics and labels work together, it becomes a powerful tool for understanding your system's behavior.
It's not overly complex, but there are enough nuances—like handling counters vs. gauges or knowing when to use by vs. without —that it pays to experiment and dig into the official docs occasionally.
Basically that's it.
The above is the detailed content of What is the Prometheus Query Language (PromQL)?. For more information, please follow other related articles on the PHP Chinese website!

Hot AI Tools

Undress AI Tool
Undress images for free

Undresser.AI Undress
AI-powered app for creating realistic nude photos

AI Clothes Remover
Online AI tool for removing clothes from photos.

Clothoff.io
AI clothes remover

Video Face Swap
Swap faces in any video effortlessly with our completely free AI face swap tool!

Hot Article
Hot Tools

Notepad++7.3.1
Easy-to-use and free code editor

SublimeText3 Chinese version
Chinese version, very easy to use

Zend Studio 13.0.1
Powerful PHP integrated development environment

Dreamweaver CS6
Visual web development tools

SublimeText3 Mac version
God-level code editing software (SublimeText3)
Hot Topics


 10 Best File Comparison and Difference (Diff) Tools in Linux
Jun 11, 2025 am 10:26 AM
10 Best File Comparison and Difference (Diff) Tools in Linux
Jun 11, 2025 am 10:26 AM
While writing program files or normal text files, programmers and writers sometimes want to know the difference between two files or two versions of the same file. When you compare two computer files on Linux, the difference between their contents is
 How to create a new, empty file from the command line?
Jun 14, 2025 am 12:18 AM
How to create a new, empty file from the command line?
Jun 14, 2025 am 12:18 AM
There are three ways to create empty files in the command line: First, the simplest and safest use of the touch command, which is suitable for debugging scripts or placeholder files; Second, it is quickly created through > redirection but will clear existing content, which is suitable for initializing log files; Third, use echo"> file name to create a file with an empty string, or use echo-n""> file name to avoid line breaks. These three methods have their own applicable scenarios, and choosing the right method can help you complete the task more efficiently.
 5 Best Open Source Mathematical Equation Editors for Linux
Jun 18, 2025 am 09:28 AM
5 Best Open Source Mathematical Equation Editors for Linux
Jun 18, 2025 am 09:28 AM
Are you looking for good software to write mathematical equations? If so, this article provides the top 5 equation editors that you can easily install on your favorite Linux distribution.In addition to being compatible with different types of mathema
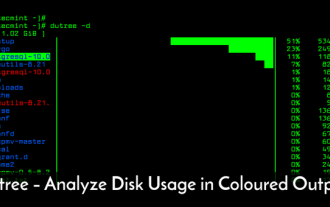 dutree - Analyze File System Disk Usage in Linux
Jun 11, 2025 am 10:33 AM
dutree - Analyze File System Disk Usage in Linux
Jun 11, 2025 am 10:33 AM
dutree is a free, open-source, fast command-line tool for analyzing disk usage, written in the Rust programming language. It was created by combining durep (disk usage reporter) and tree (list directory content in tree-like format) command-line tools
 How to Install Eclipse IDE in Debian, Ubuntu, and Linux Mint
Jun 14, 2025 am 10:40 AM
How to Install Eclipse IDE in Debian, Ubuntu, and Linux Mint
Jun 14, 2025 am 10:40 AM
Eclipse is a free integrated development environment (IDE) that programmers around the world use to write software, primarily in Java, but also in other major programming languages using Eclipse plugins.The latest release of Eclipse IDE 2023?06 does
 15 Useful 'ifconfig' Commands to Configure Network in Linux
Jun 11, 2025 am 10:01 AM
15 Useful 'ifconfig' Commands to Configure Network in Linux
Jun 11, 2025 am 10:01 AM
ifconfig in short “interface configuration” utility for system/network administration in Unix/Linux operating systems to configure, manage, and query network interface parameters via command-line interface or in a system configuration scripts
 SCP Linux Command – Securely Transfer Files in Linux
Jun 20, 2025 am 09:16 AM
SCP Linux Command – Securely Transfer Files in Linux
Jun 20, 2025 am 09:16 AM
Linux administrators should be familiar with the command-line environment. Since GUI (Graphical User Interface) mode in Linux servers is not commonly installed.SSH may be the most popular protocol to enable Linux administrators to manage the servers
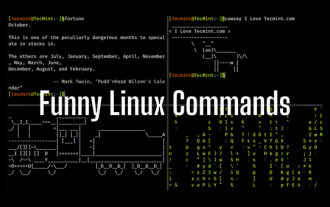 24 Hilarious Linux Commands That Will Make You Laugh
Jun 14, 2025 am 10:13 AM
24 Hilarious Linux Commands That Will Make You Laugh
Jun 14, 2025 am 10:13 AM
Linux has a rich collection of commands, and while many of them are powerful and useful for various tasks, there are also some funny and whimsical commands that you can try out for amusement. 1. sl Command (Steam Locomotive) You might be aware of the
