

Monitor Redis Droplet with Redis Exporter Service
Apr 10, 2025 pm 01:36 PM
Effective monitoring of Redis databases is critical to maintaining optimal performance, identifying potential bottlenecks, and ensuring overall system reliability. Redis Exporter Service is a powerful utility designed to monitor Redis databases using Prometheus. This tutorial will guide you through the complete setup and configuration of Redis Exporter Service, ensuring you seamlessly build monitoring solutions. By studying this tutorial, you will achieve fully operational monitoring settings

Method 1: Manual configuration
We continue with the manual configuration method in this section.
Create Prometheus system users and groups
Create a system user and group "prometheus" named to manage the exporter
sudo groupadd --system prometheus
sudo useradd -s /sbin/nologin --system -g prometheus prometheus
Download and install Redis Exporter
Download the latest version of Redis Exporter downloaded files from GitHub and move the binary to the /usr/local/bin/ directory.
curl -s https://api.github.com/repos/oliver006/redis_exporter/releases/latest | grep browser_download_url | grep linux-amd64 | cut -d '"' -f 4 | wget -qi -
tar xvf redis_exporter-*.linux-amd64.tar.gz
sudo mv redis_exporter-*.linux-amd64/redis_exporter /usr/local/bin/
Verify Redis exporter installation
redis_exporter --version
Here is the sample output:

Configure systemd service for Redis Exporter
Create a systemd service unit file to manage Redis Exporter
sudo vim /etc/systemd/system/redis_exporter.service
Add the following to the file:
 [Unit]Description=Prometheus Redis ExporterDocumentation=https://github.com/oliver006/redis_exporterWants=network-online.targetAfter=network-online.target[Service]Type=simpleUser=prometheusGroup=prometheusExecReload=/bin/kill -HUP $MAINPIDExecStart=/usr/local/bin/redis_exporter
   --log-format=txt
   --namespace=redis
   --web.listen-address=:9121
   --web.telemetry-path=/metricsSyslogIdentifier=redis_exporterRestart=always[Install]WantedBy=multi-user.target
Reload systemd and start Redis Exporter service
sudo systemctl daemon-reload
sudo systemctl enable redis_exporter
sudo systemctl start redis_exporter
Configuring Prometheus Droplet (manual method)
Let's configure the Prometheous Droplet manually.
Backup the prometheus.yml file
cp /etc/prometheus/prometheus.yml /etc/prometheus/prometheus.yml-$(date '%d%b%Y-%H:%M')
Add Redis Exporter endpoint scraped
Log in to your Prometheus server and add the Redis Exporter endpoint to crawl.
Replace the IP address and port with your Redis Exporter endpoint (9121 is the default port for Redis Exporter service).
vi /etc/prometheus/prometheus.yml
 scrape_configs:
  - job_name: server1_db
    static_configs:
      - targets: ['10.10.1.10:9121']
        labels:
          alias: db1

  - job_name: server2_db
    static_configs:
      - targets: ['10.10.1.11:9121']
        labels:
Manual configuration ends here. Now, let's continue with script-based configuration.
Method 2: Use scripts to configure
You can also do this by running two scripts - one for the target Droplet and the other for the Prometheus Droplet.
Let's start by configuring the target Droplet.
Connect to the target Droplet via SSH.
Use the following command to download the target configuration script:
wget https://solutions-files.ams3.digitalocianspaces.com/Redis-Monitoring/DO_Redis_Target_Config.sh
After downloading the script, make sure it has executable permissions to run:
chmod x DO_Redis_Target_Config.sh
Execute the script by running the following command:
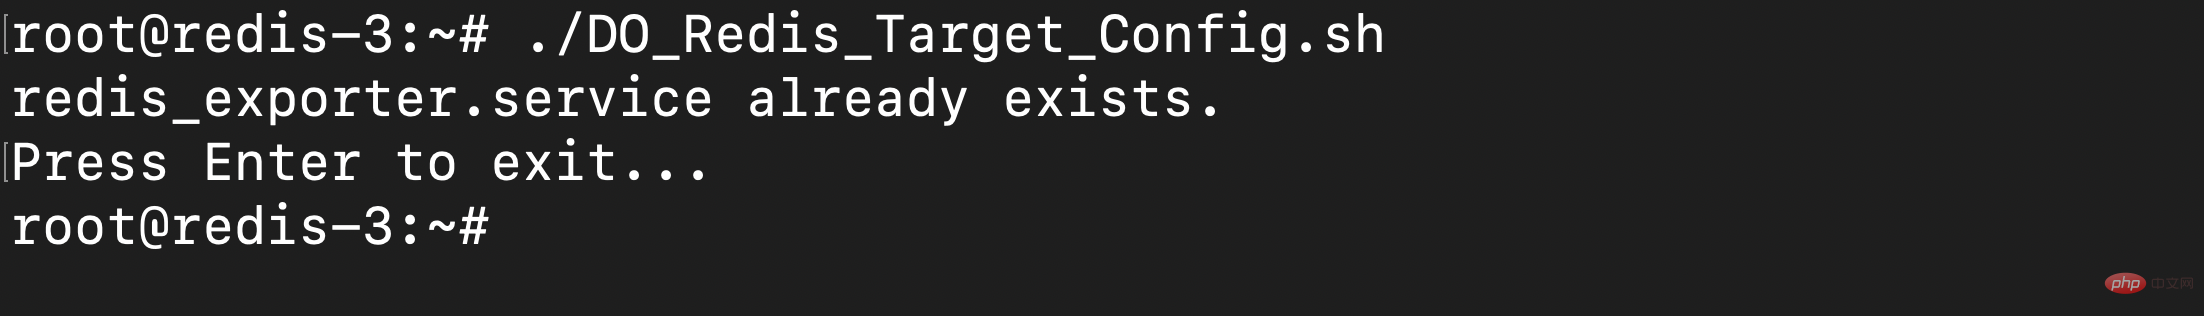
./DO_Redis_Target_Config.sh
Configuration
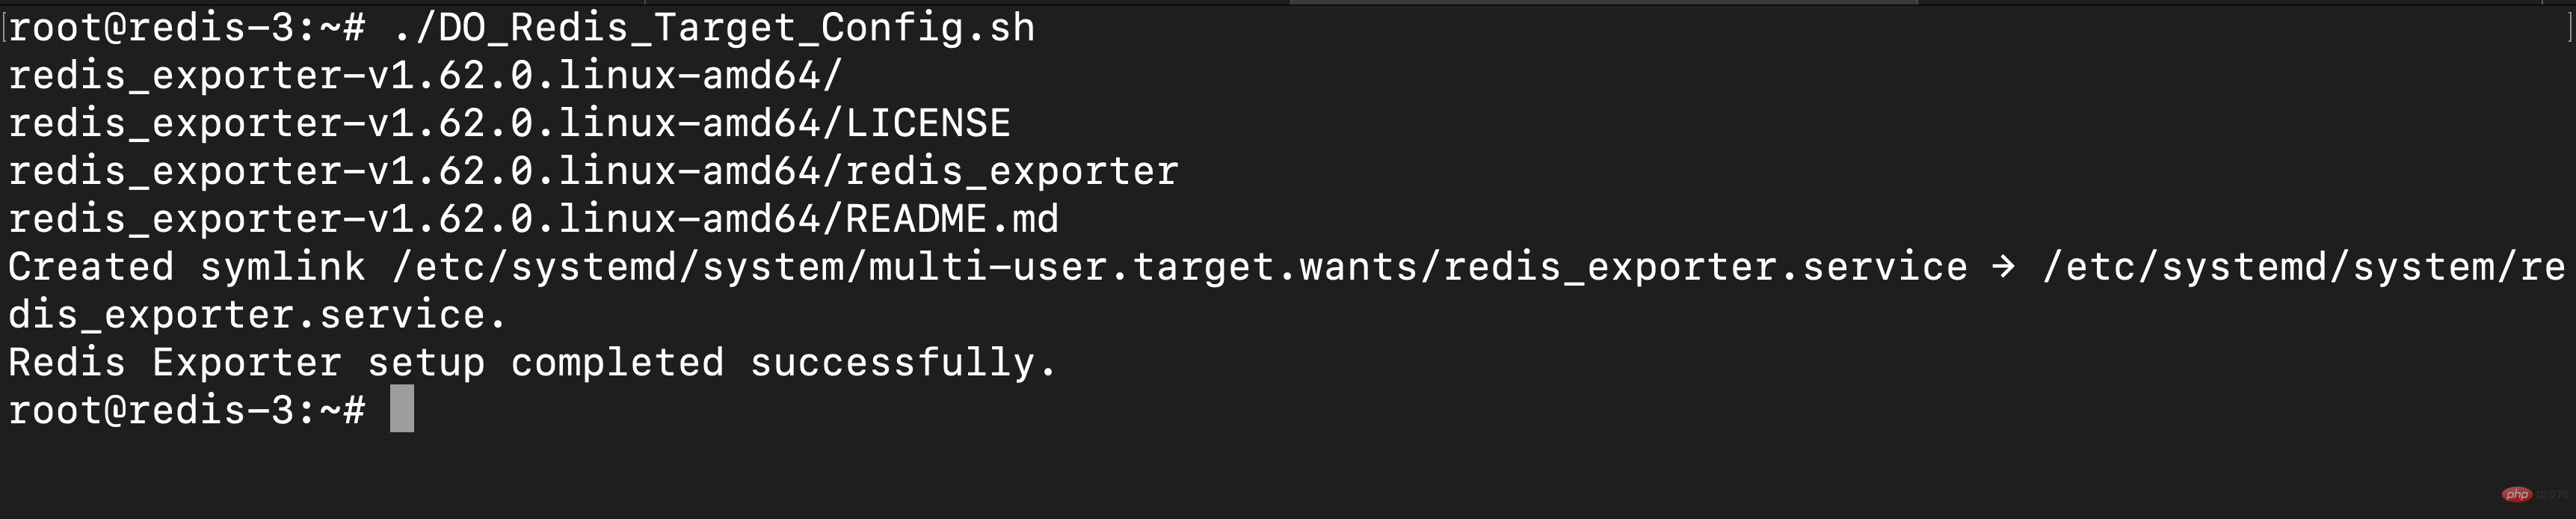
Note: If the redis_exporter.service file already exists, the script will not run.
Configure Prometheus Droplet (Script Method)
SSH to Prometheus Droplet and download the script using the following command:
wget https://solutions-files.ams3.digitalocianspaces.com/Redis-Monitoring/DO_Redis_Prometheus_Config.sh
After downloading the script, make sure it has executable permissions to run:
chmod x DO_Redis_Prometheus_Config.sh
Execute script running:
./DO_Redis_Prometheus_Config.sh
Enter the number of droplets to add to the monitoring.
Enter the host name and IP address.
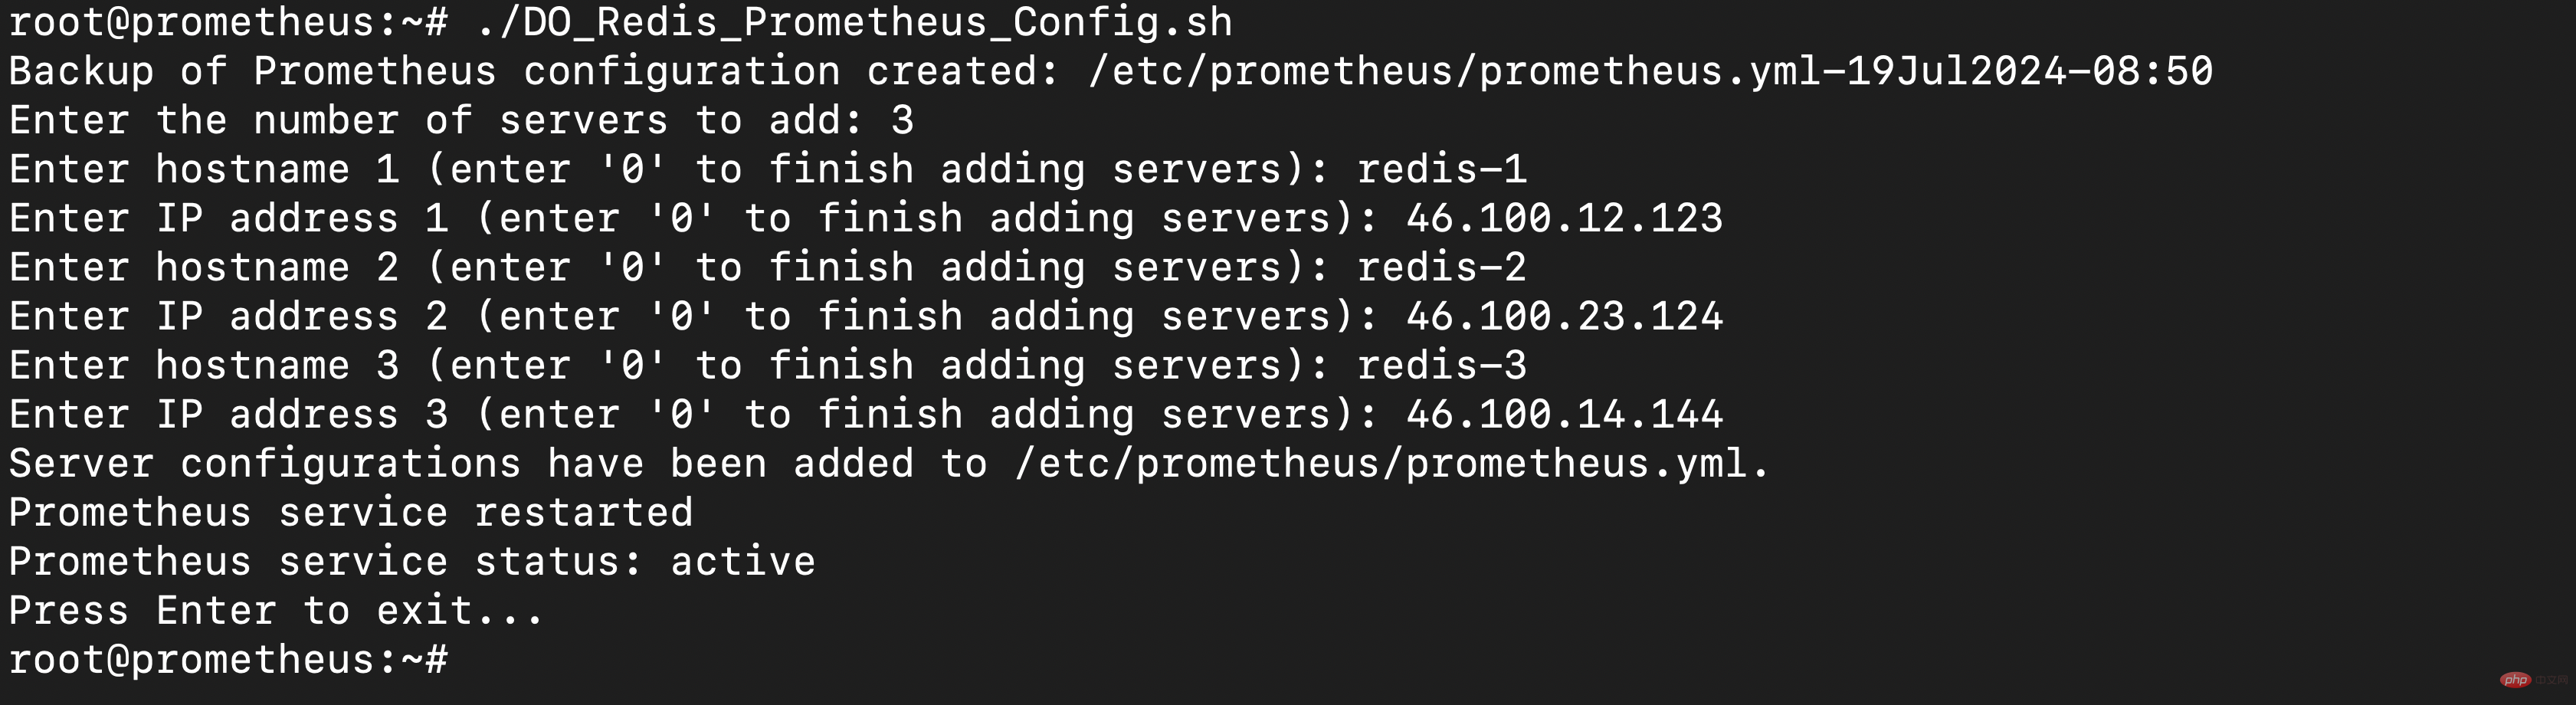
Configuration is complete.
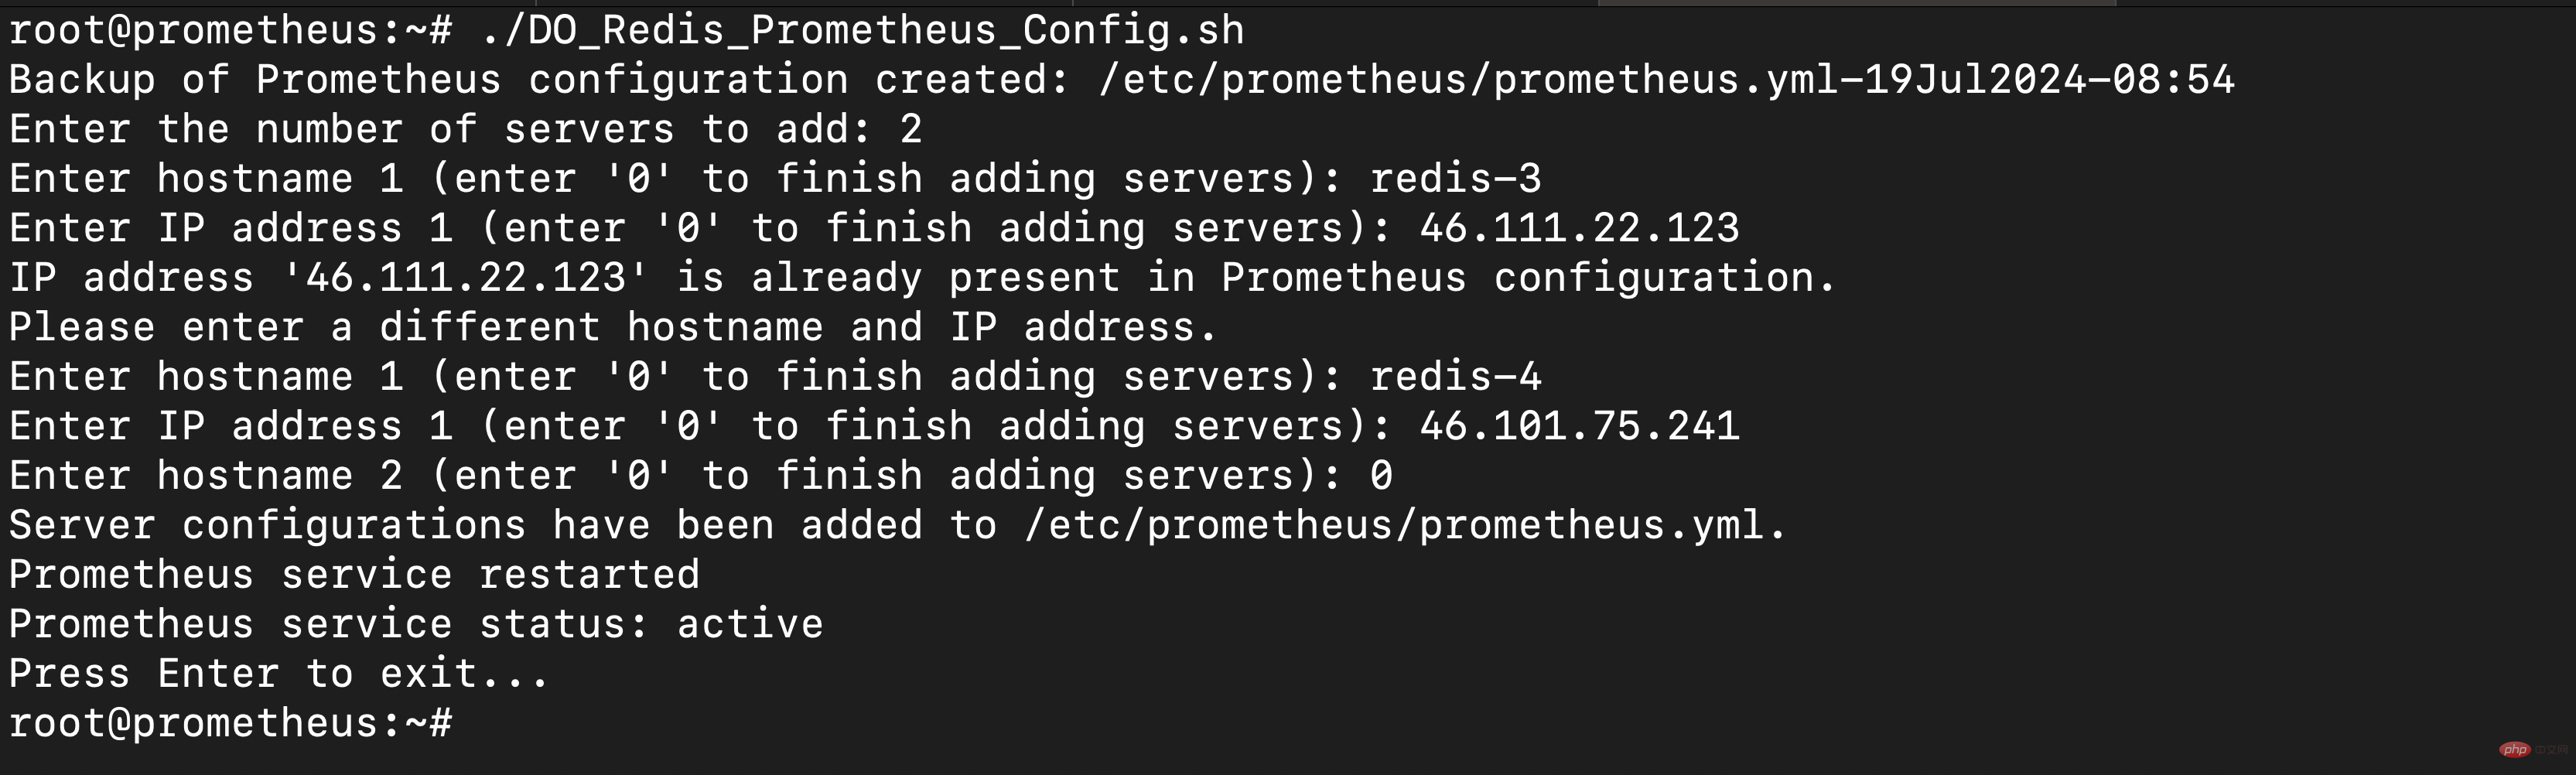
After adding, check whether the target is updated by accessing the URL prometheushostname:9090/targets.
Note: If the IP address you entered has been added to the monitoring, you will be asked to enter the details again. Also, if you don't have more servers to add, you can enter 0 to exit script
Configure Grafana
Access Grafana-IP:3000 through your browser to log in to the Grafana dashboard.
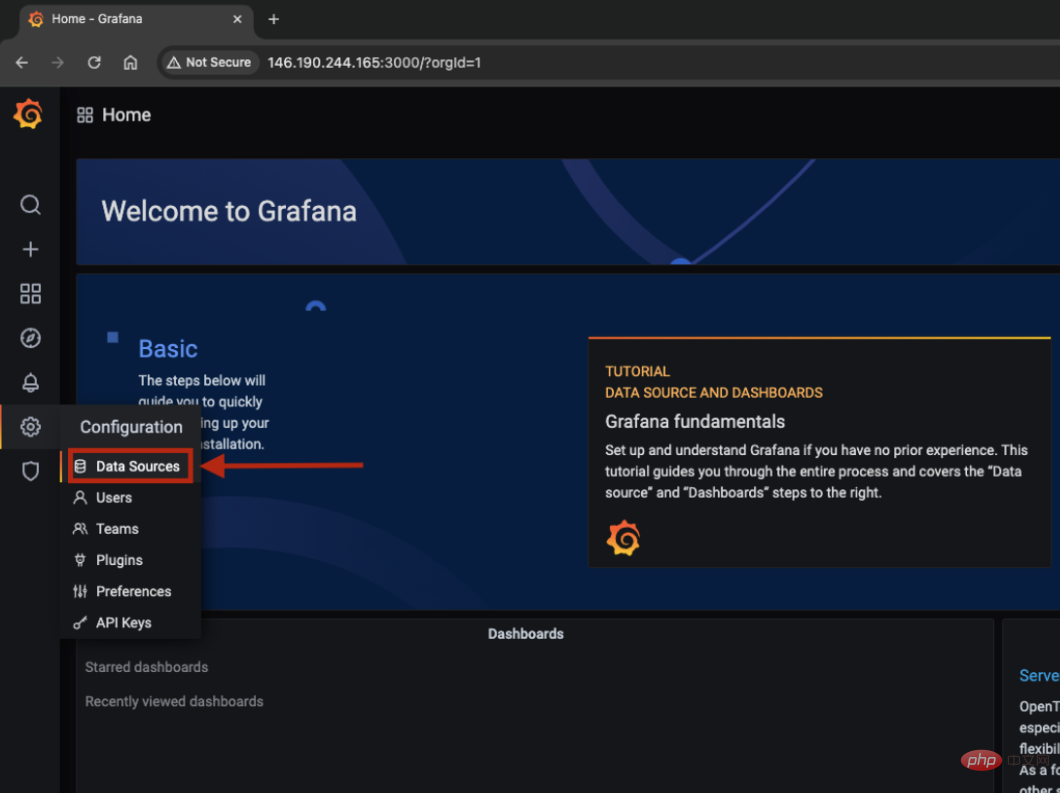
Go to Configuration > Data Source.
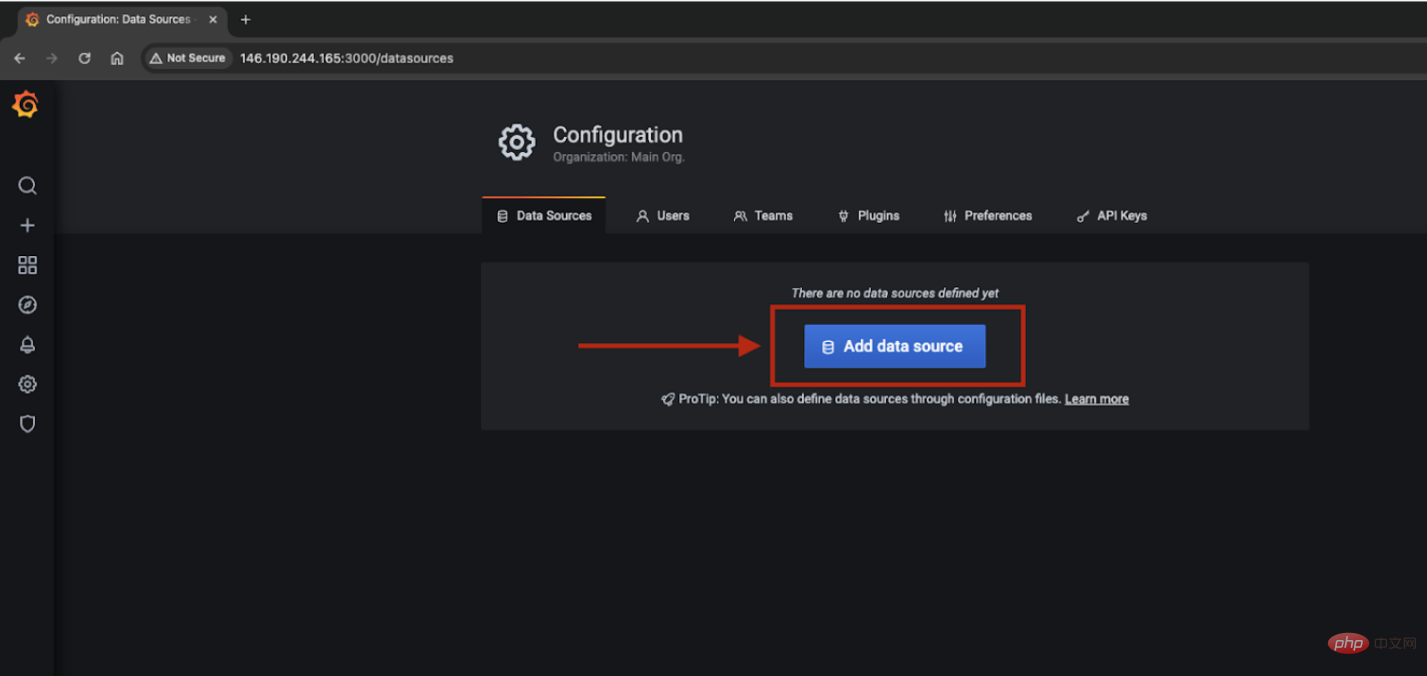
Click Add Data Source.
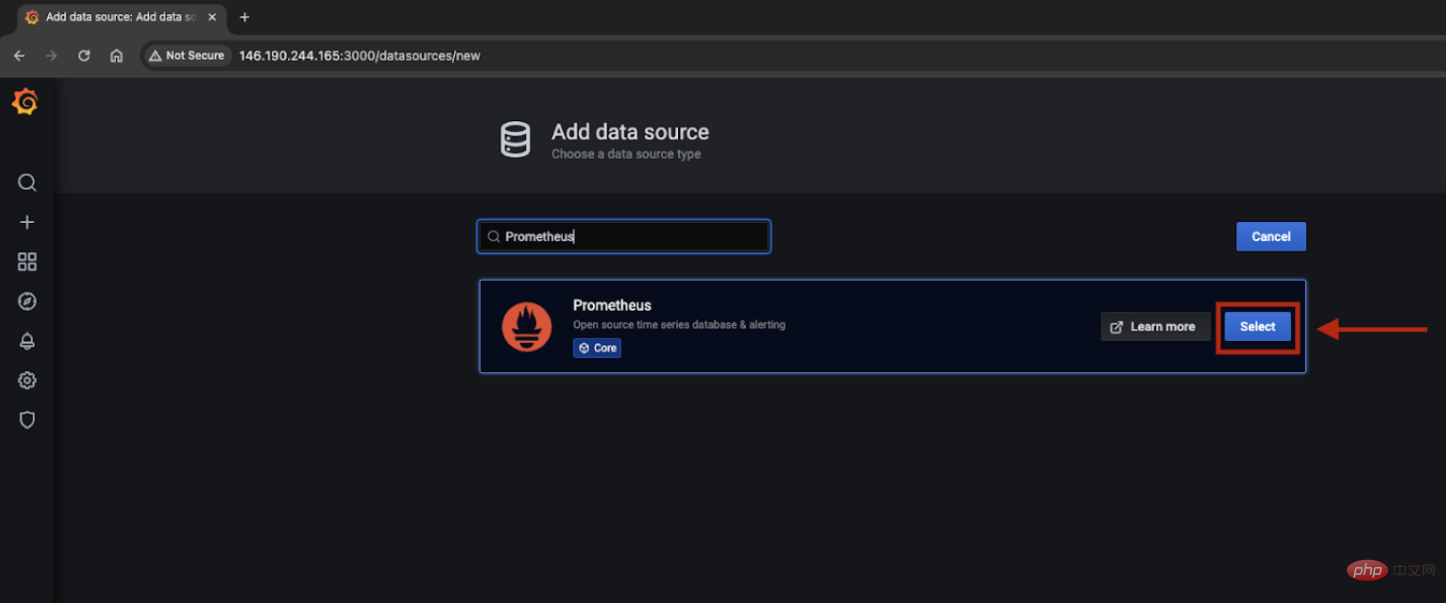
Search and select Prometheus.
Enter the name Prometheus and URL (Prometheus hostname: 9090) and click Save and Test. If you see "Data Source is running", you have successfully added the data source. When finished, go to Create > Import.
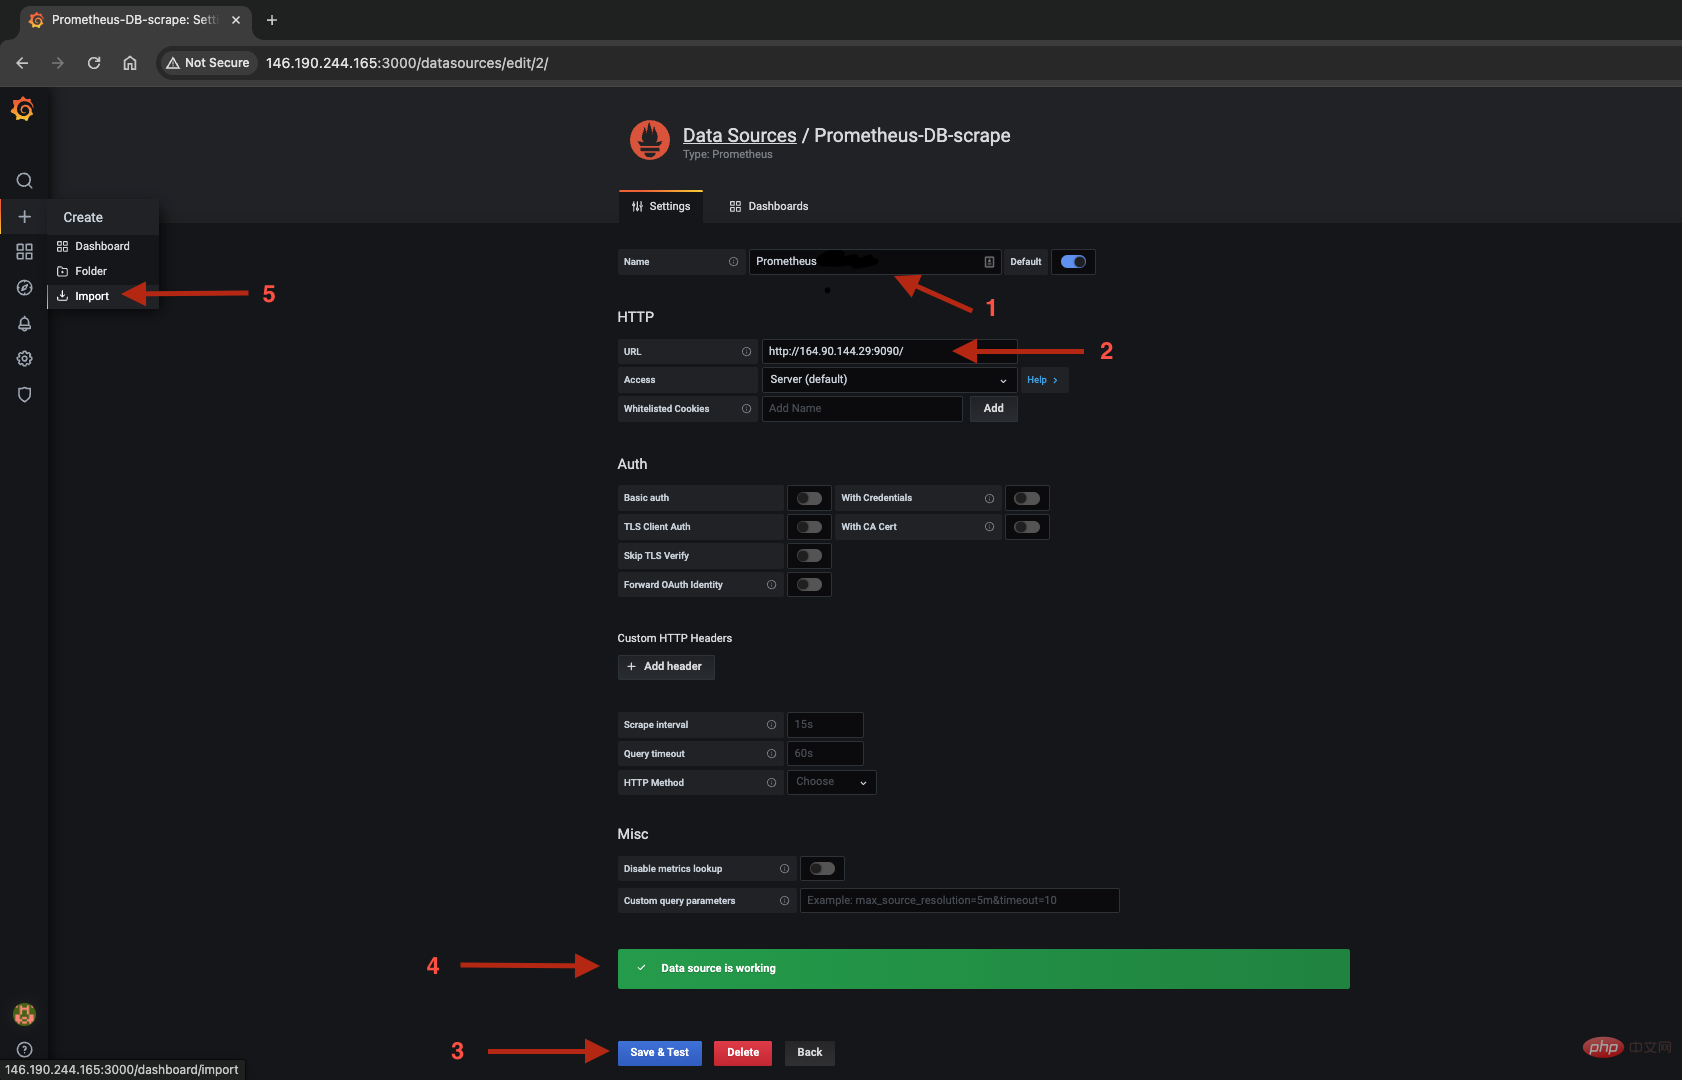
You can configure the dashboard manually or import the dashboard to upload the JSON file by importing it through the following methods. The JSON template for Redis monitoring can be found in the following link:
https://solutions-files.ams3.digitalocianspaces.com/Redis-Monitoring/DO_Grafana-Redis_Monitoring.json
Fill in the fields and import them.
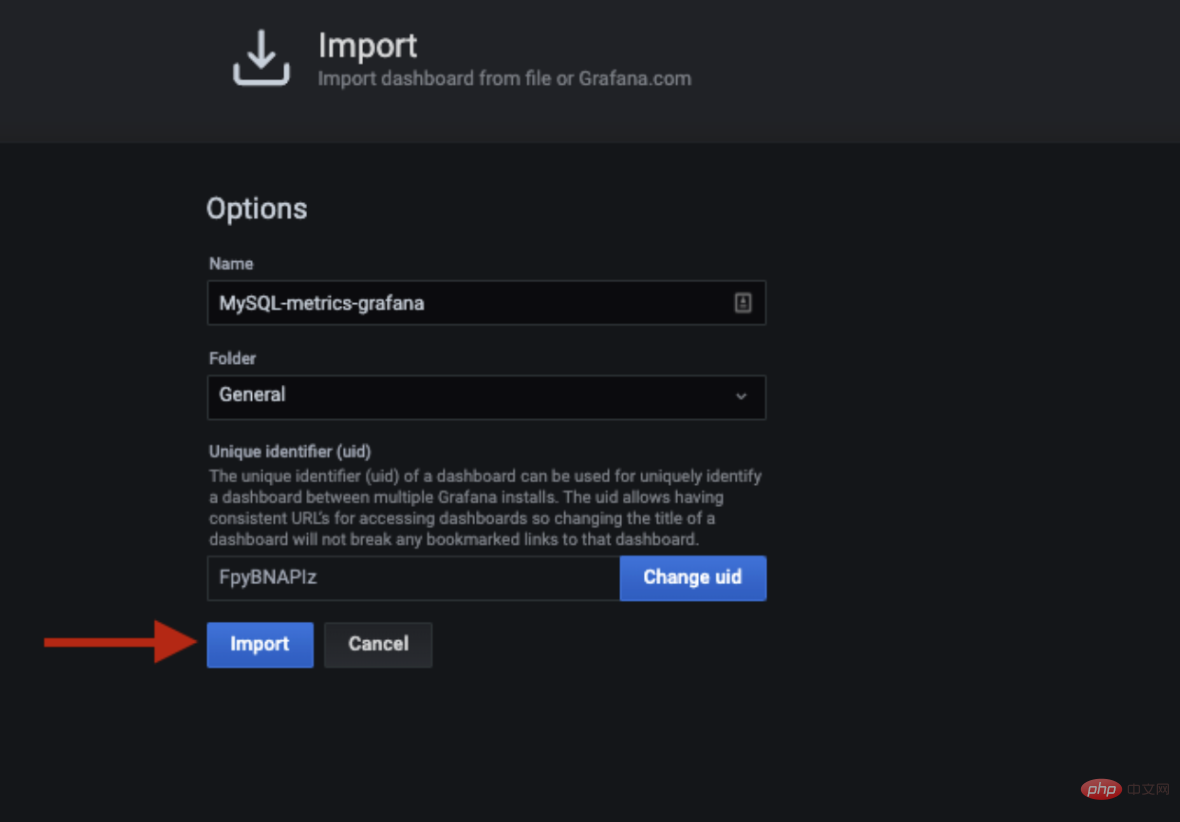
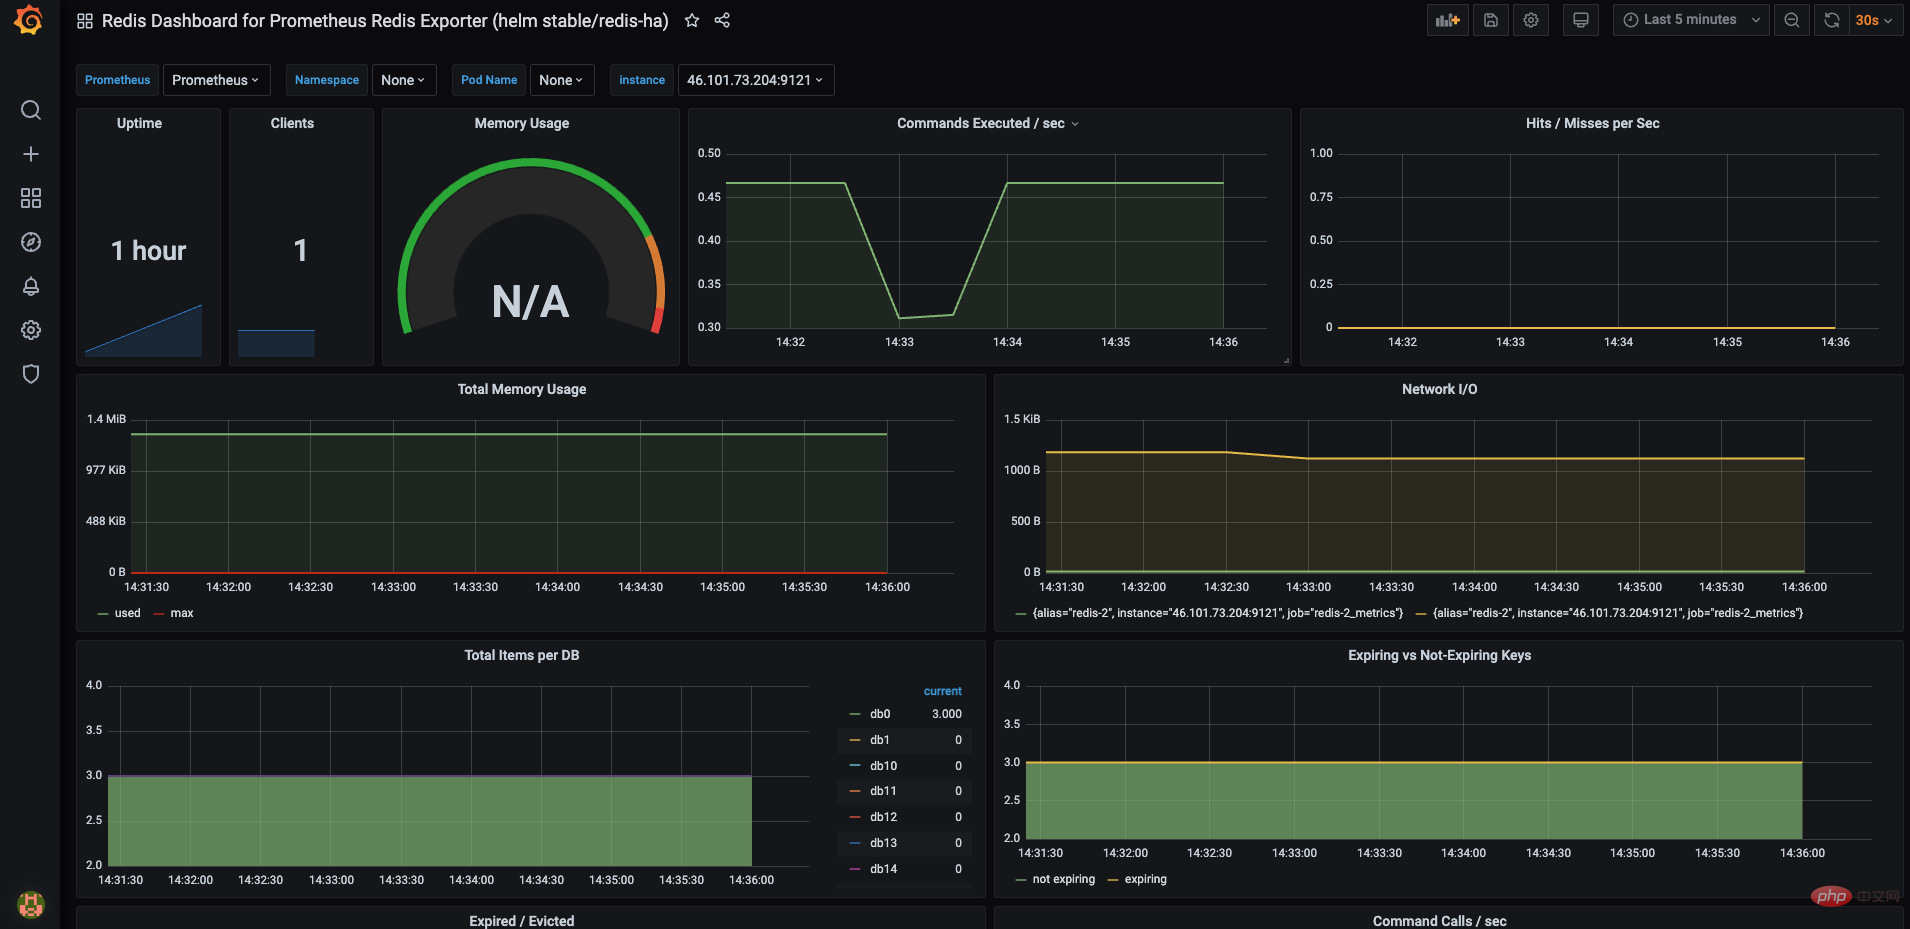
The Grafana dashboard is ready. Select the host and check if the metric is visible. Feel free to modify and edit the dashboard as needed.
The above is the detailed content of Monitor Redis Droplet with Redis Exporter Service. For more information, please follow other related articles on the PHP Chinese website!

Hot AI Tools

Undress AI Tool
Undress images for free

Undresser.AI Undress
AI-powered app for creating realistic nude photos

AI Clothes Remover
Online AI tool for removing clothes from photos.

Clothoff.io
AI clothes remover

Video Face Swap
Swap faces in any video effortlessly with our completely free AI face swap tool!

Hot Article
Hot Tools

Notepad++7.3.1
Easy-to-use and free code editor

SublimeText3 Chinese version
Chinese version, very easy to use

Zend Studio 13.0.1
Powerful PHP integrated development environment

Dreamweaver CS6
Visual web development tools

SublimeText3 Mac version
God-level code editing software (SublimeText3)
Hot Topics


 Strategies for MySQL Query Performance Optimization
Jul 13, 2025 am 01:45 AM
Strategies for MySQL Query Performance Optimization
Jul 13, 2025 am 01:45 AM
MySQL query performance optimization needs to start from the core points, including rational use of indexes, optimization of SQL statements, table structure design and partitioning strategies, and utilization of cache and monitoring tools. 1. Use indexes reasonably: Create indexes on commonly used query fields, avoid full table scanning, pay attention to the combined index order, do not add indexes in low selective fields, and avoid redundant indexes. 2. Optimize SQL queries: Avoid SELECT*, do not use functions in WHERE, reduce subquery nesting, and optimize paging query methods. 3. Table structure design and partitioning: select paradigm or anti-paradigm according to read and write scenarios, select appropriate field types, clean data regularly, and consider horizontal tables to divide tables or partition by time. 4. Utilize cache and monitoring: Use Redis cache to reduce database pressure and enable slow query
 how to check which storage engine is used in mysql
Jul 13, 2025 am 02:00 AM
how to check which storage engine is used in mysql
Jul 13, 2025 am 02:00 AM
The method of viewing the storage engine of MySQL is as follows: 1. You can use the command SHOWVARIABLESLIKE'default_storage_engine'; 2. You can use the storage engine used to view a certain table to view the storage engine through SHOWCREATETABLE or query information_schema.TABLES; 3. You can use SELECTTABLE_NAME,ENGINEFROMinformation_schema.TABLESWHERETABLE_SCHEMA='your_database'; 4. Other methods include on the command line
 Securing MySQL installations with SSL/TLS connections
Jul 13, 2025 am 02:16 AM
Securing MySQL installations with SSL/TLS connections
Jul 13, 2025 am 02:16 AM
To configure MySQL's SSL/TLS encrypted connection, first generate a self-signed certificate and correctly configure the server and client settings. 1. Use OpenSSL to generate CA private key, CA certificate, server private key and certificate request, and sign the server certificate yourself; 2. Place the generated certificate file in the specified directory, and configure the ssl-ca, ssl-cert and ssl-key parameters in my.cnf or mysqld.cnf and restart MySQL; 3. Force SSL on the client, restrict users from connecting only through SSL through the GRANTUSAGE command, or specify the --ssl-mode=REQUIRED parameter when connecting; 4. After logging in, execute \s to check SSL status confirmation
 mysql temporary table vs memory table
Jul 13, 2025 am 02:23 AM
mysql temporary table vs memory table
Jul 13, 2025 am 02:23 AM
Temporary tables are tables with limited scope, and memory tables are tables with different storage methods. Temporary tables are visible in the current session and are automatically deleted after the connection is disconnected. Various storage engines can be used, which are suitable for saving intermediate results and avoiding repeated calculations; 1. Temporary tables support indexing, and multiple sessions can create tables with the same name without affecting each other; 2. The memory table uses the MEMORY engine, and the data is stored in memory, and the restart is lost, which is suitable for cache small data sets with high frequency access; 3. The memory table supports hash indexing, and does not support BLOB and TEXT types, so you need to pay attention to memory usage; 4. The life cycle of the temporary table is limited to the current session, and the memory table is shared by all connections. When choosing, it should be decided based on whether the data is private, whether high-speed access is required and whether it can tolerate loss.
 mysql common table expression (cte) example
Jul 14, 2025 am 02:28 AM
mysql common table expression (cte) example
Jul 14, 2025 am 02:28 AM
CTE is a temporary result set in MySQL used to simplify complex queries. It can be referenced multiple times in the current query, improving code readability and maintenance. For example, when looking for the latest orders for each user in the orders table, you can first obtain the latest order date for each user through the CTE, and then associate it with the original table to obtain the complete record. Compared with subqueries, the CTE structure is clearer and the logic is easier to debug. Usage tips include explicit alias, concatenating multiple CTEs, and processing tree data with recursive CTEs. Mastering CTE can make SQL more elegant and efficient.
 how to use sqlalchemy with mysql
Jul 13, 2025 am 02:24 AM
how to use sqlalchemy with mysql
Jul 13, 2025 am 02:24 AM
The steps to operate MySQL using SQLAlchemy are as follows: 1. Install dependencies and configure connections; 2. Define the model or use native SQL; 3. Perform database operations through session or engine. First, you need to install sqlalchemy and mysql-connector-python, and then create an engine in the format create_engine('mysql mysqlconnector://user:password@host/database_name'). Then you can describe the table structure by defining the model class and use Base.metadata.create_all(engine)
 Choosing appropriate data types for columns in MySQL tables
Jul 15, 2025 am 02:25 AM
Choosing appropriate data types for columns in MySQL tables
Jul 15, 2025 am 02:25 AM
WhensettingupMySQLtables,choosingtherightdatatypesiscrucialforefficiencyandscalability.1)Understandthedataeachcolumnwillstore—numbers,text,dates,orflags—andchooseaccordingly.2)UseCHARforfixed-lengthdatalikecountrycodesandVARCHARforvariable-lengthdata
 How to create responsive images using CSS?
Jul 15, 2025 am 01:10 AM
How to create responsive images using CSS?
Jul 15, 2025 am 01:10 AM
To create responsive images using CSS, it can be mainly achieved through the following methods: 1. Use max-width:100% and height:auto to allow the image to adapt to the container width while maintaining the proportion; 2. Use HTML's srcset and sizes attributes to intelligently load the image sources adapted to different screens; 3. Use object-fit and object-position to control image cropping and focus display. Together, these methods ensure that the images are presented clearly and beautifully on different devices.
