
 Software Tutorial
Office Software
Use the PERCENTOF Function to Simplify Percentage Calculations in Excel
Software Tutorial
Office Software
Use the PERCENTOF Function to Simplify Percentage Calculations in Excel
Use the PERCENTOF Function to Simplify Percentage Calculations in Excel
Mar 27, 2025 am 03:03 AM
Excel's PERCENTOF function: Easily calculate the proportion of data subsets
Excel's PERCENTOF function can quickly calculate the proportion of data subsets in the entire data set, avoiding the hassle of creating complex formulas.
PERCENTOF function syntax
The PERCENTOF function has two parameters:
<code>=PERCENTOF(a,b)</code>
in:
- a (required) is a subset of data that forms part of the entire data set;
- b (required) is the entire dataset.
In other words, the PERCENTOF function calculates the percentage of the subset a to the total dataset b .
Calculate the proportion of individual values ??using PERCENTOF
The easiest way to use the PERCENTOF function is to calculate the proportion of a single value in the sum.
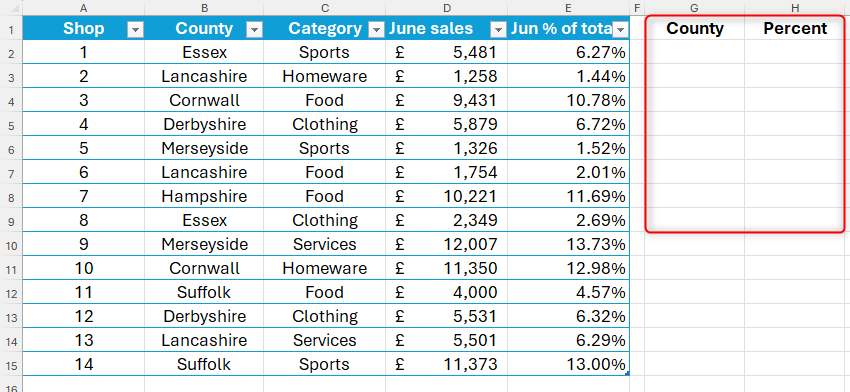
For example, analyze the performance of 14 stores in England in June and calculate the contribution of each store to total sales for the month.
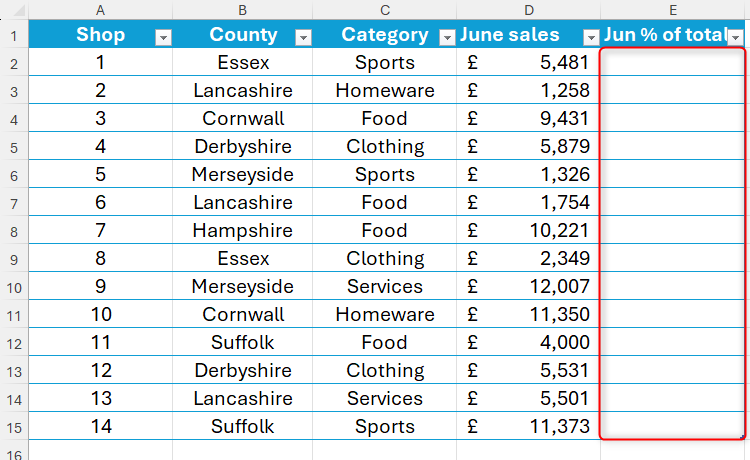
This example uses formatted Excel tables and structured references to make the formula easier to understand. If more data is added on line 16 and below, the new value will be automatically included in the calculation. If you do not use tables and structured references, you may need to adjust the formula to include absolute references and update the formula when adding more data rows.
Enter in cell E2:
<code>=PERCENTOF(</code>
Then click on cell D2 (the subset of data to calculate its contribution to the sum). If formatted tables are used, this forces Excel to add column names to the formula, while the @ symbol indicates that each row will be considered separately in the result. Then add a comma:
<code>=PERCENTOF([@[June sales]],</code>
Finally, select all the data in column D (including the data subset selected in the previous step, but not the column header), telling Excel which cells make up the entire dataset. This will be displayed in the formula as the column name in square brackets. Then close the original parentheses.
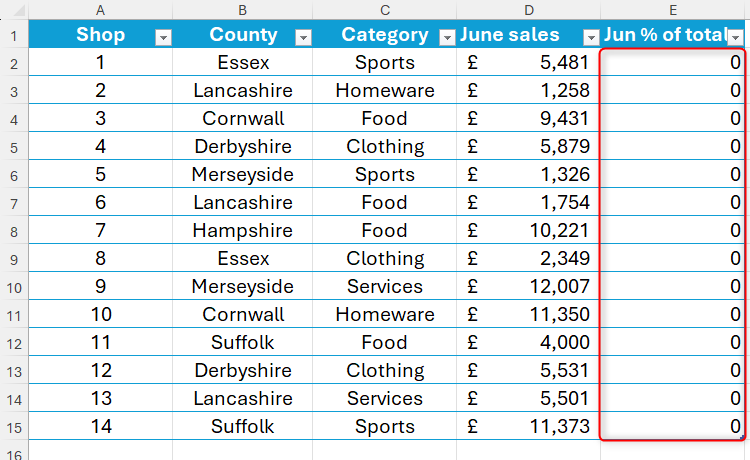
<code>=PERCENTOF([@[June sales]],[June sales])</code>
After pressing Enter, the result will be displayed as a series of zeros. Don't worry, this is because the data in the percentage column is currently expressed as a decimal, not a percentage.
To change these values ??from a decimal to a percentage, select all affected cells and click the % icon in the Numbers group of the Ribbon Start tab. Meanwhile, click the "Increase Decimals" button to add decimals, which will help distinguish similar values.
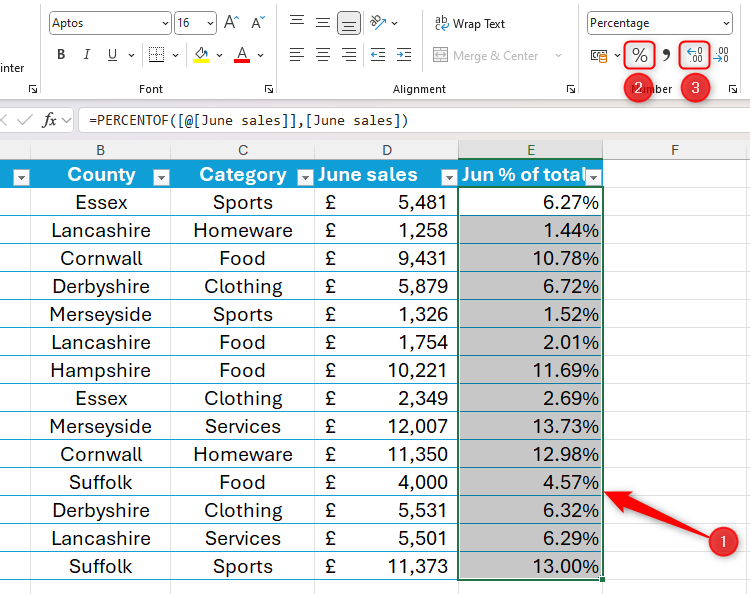
This gives a formatted Excel table with a column showing how each store contributes to total sales.
Related content##### Excel’s 12 digital format options and their impact on data
Adjust the number format of the cell to match its data type.
using PERCENTOF with GROUPBY
While PERCENTOF can be used alone to display individual percentage contributions, it is mainly added to Excel for use with other functions. Specifically, PERCENTOF works very well with GROUPBY, and you can further subdivide the data into specified categories and display the output as a percentage.
Keep using the store sales data example above, assuming the goal is to find out which counties attract the largest percentage of sales.
Because GROUPBY creates dynamic arrays, this function cannot be used in formatted Excel tables. This is why you need to create a data retrieval form in a spreadsheet area that is not formatted as a table.
To do this, enter:
<code>=GROUPBY(Sales[County],Sales[June sales],PERCENTOF)</code>
in:
- Sales[County] is the field in the original Sales table that will determine the grouping;
- Sales[June sales] is a field containing the value that will generate the percentage;
- PERCENTOF is a function that converts raw data into comparison values.

Related content##### How to name tables in Microsoft Excel
"Table1" is not explained clearly enough...
GROUPBY function also allows input of five additional optional fields such as field title, sort order, and filter array, but in this case these fields are omitted to show how to use them with PERCENTOF in the simplest form.
After pressing Enter, Excel will group sales by county (alphabetical by default), displaying data in decimals.
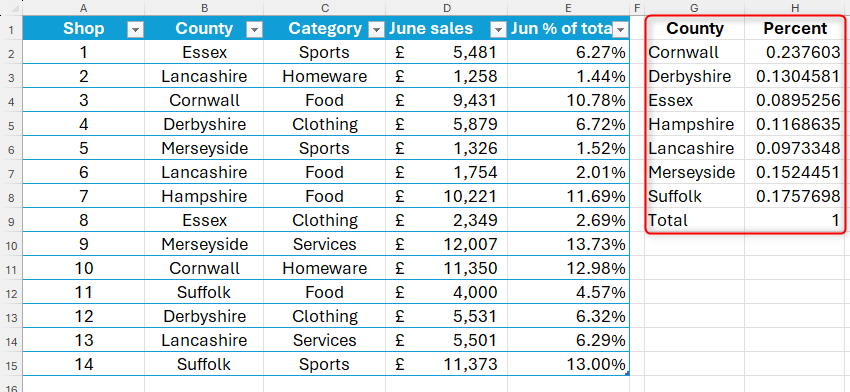
To convert these decimals into percentages, select these numbers and click the % icon in the Numbers group of the Start tab of the ribbon. You can also adjust the decimal places of a percentage number by clicking the "Increase Decimal places" or "Decimal places" buttons in the same tab group.
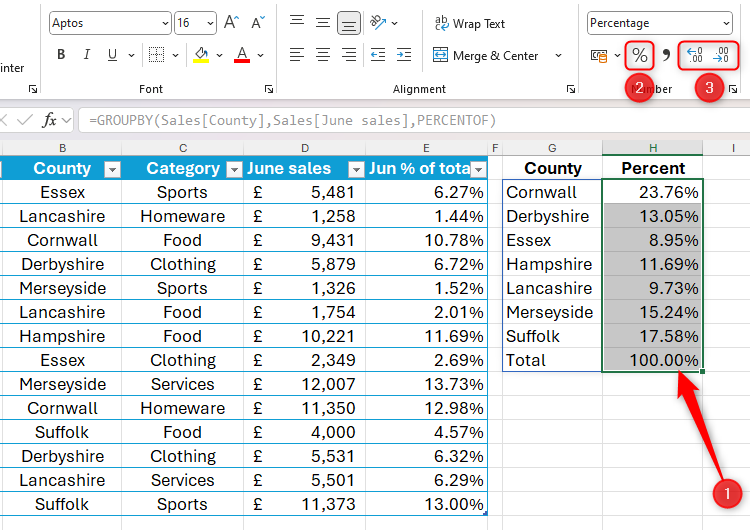
Now, even if the data changes dramatically, the GROUPBY function picks up these changes and adjusts the classification table accordingly.
The application of PERCENTOF is much more than that! For example, you can embed this function in PIVOTBY, further segment the data using multiple variables, and then display the output as a percentage.
The above is the detailed content of Use the PERCENTOF Function to Simplify Percentage Calculations in Excel. For more information, please follow other related articles on the PHP Chinese website!

Hot AI Tools

Undress AI Tool
Undress images for free

Undresser.AI Undress
AI-powered app for creating realistic nude photos

AI Clothes Remover
Online AI tool for removing clothes from photos.

Clothoff.io
AI clothes remover

Video Face Swap
Swap faces in any video effortlessly with our completely free AI face swap tool!

Hot Article
Hot Tools

Notepad++7.3.1
Easy-to-use and free code editor

SublimeText3 Chinese version
Chinese version, very easy to use

Zend Studio 13.0.1
Powerful PHP integrated development environment

Dreamweaver CS6
Visual web development tools

SublimeText3 Mac version
God-level code editing software (SublimeText3)
Hot Topics


 How to Use Parentheses, Square Brackets, and Curly Braces in Microsoft Excel
Jun 19, 2025 am 03:03 AM
How to Use Parentheses, Square Brackets, and Curly Braces in Microsoft Excel
Jun 19, 2025 am 03:03 AM
Quick Links Parentheses: Controlling the Order of Opera
 How to insert date picker in Outlook emails and templates
Jun 13, 2025 am 11:02 AM
How to insert date picker in Outlook emails and templates
Jun 13, 2025 am 11:02 AM
Want to insert dates quickly in Outlook? Whether you're composing a one-off email, meeting invite, or reusable template, this guide shows you how to add a clickable date picker that saves you time. Adding a calendar popup to Outlook email
 Outlook Quick Access Toolbar: customize, move, hide and show
Jun 18, 2025 am 11:01 AM
Outlook Quick Access Toolbar: customize, move, hide and show
Jun 18, 2025 am 11:01 AM
This guide will walk you through how to customize, move, hide, and show the Quick Access Toolbar, helping you shape your Outlook workspace to fit your daily routine and preferences. The Quick Access Toolbar in Microsoft Outlook is a usefu
 Prove Your Real-World Microsoft Excel Skills With the How-To Geek Test (Intermediate)
Jun 14, 2025 am 03:02 AM
Prove Your Real-World Microsoft Excel Skills With the How-To Geek Test (Intermediate)
Jun 14, 2025 am 03:02 AM
Whether you've secured a data-focused job promotion or recently picked up some new Microsoft Excel techniques, challenge yourself with the How-To Geek Intermediate Excel Test to evaluate your proficiency!This is the second in a three-part series. The
 How to Switch to Dark Mode in Microsoft Excel
Jun 13, 2025 am 03:04 AM
How to Switch to Dark Mode in Microsoft Excel
Jun 13, 2025 am 03:04 AM
More and more users are enabling dark mode on their devices, particularly in apps like Excel that feature a lot of white elements. If your eyes are sensitive to bright screens, you spend long hours working in Excel, or you often work after dark, swit
 How to Delete Rows from a Filtered Range Without Crashing Excel
Jun 14, 2025 am 12:53 AM
How to Delete Rows from a Filtered Range Without Crashing Excel
Jun 14, 2025 am 12:53 AM
Quick LinksWhy Deleting Filtered Rows Crashes ExcelSort the Data First to Prevent Excel From CrashingRemoving rows from a large filtered range in Microsoft Excel can be time-consuming, cause the program to temporarily become unresponsive, or even lea
 Microsoft Excel Essential Skills Test
Jun 12, 2025 pm 12:01 PM
Microsoft Excel Essential Skills Test
Jun 12, 2025 pm 12:01 PM
Whether you've landed a job interview for a role that requires basic Microsoft Excel skills or you're looking to solve a real-world problem, take the How-To Geek Beginner Excel Test to verify that you understand the fundamentals of this popular sprea
 Google Sheets IMPORTRANGE: The Complete Guide
Jun 18, 2025 am 09:54 AM
Google Sheets IMPORTRANGE: The Complete Guide
Jun 18, 2025 am 09:54 AM
Ever played the "just one quick copy-paste" game with Google Sheets... and lost an hour of your life? What starts as a simple data transfer quickly snowballs into a nightmare when working with dynamic information. Those "quick fixes&qu
